
What next for the FTSE 100?
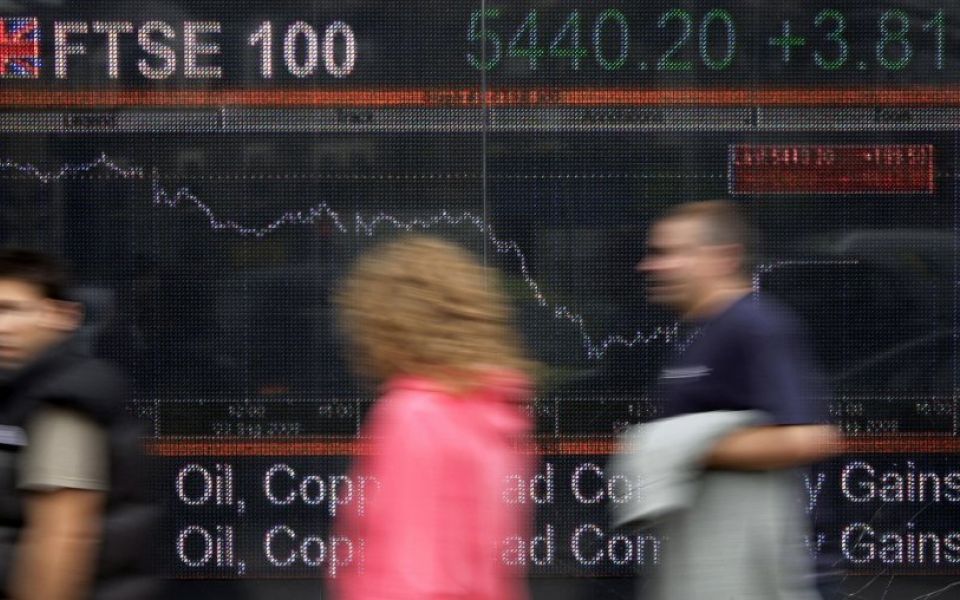
The FTSE 100 largely brushed aside concerns over Brexit and the US election in 2016 to hit its highest ever level of 7,129.83.
However, the index has struggled to maintain its momentum and push on from that record high reached in October.
Here we take a look at why the index remains near record highs but is struggling to rise higher, and we examine if it’s still cheap going into 2017.
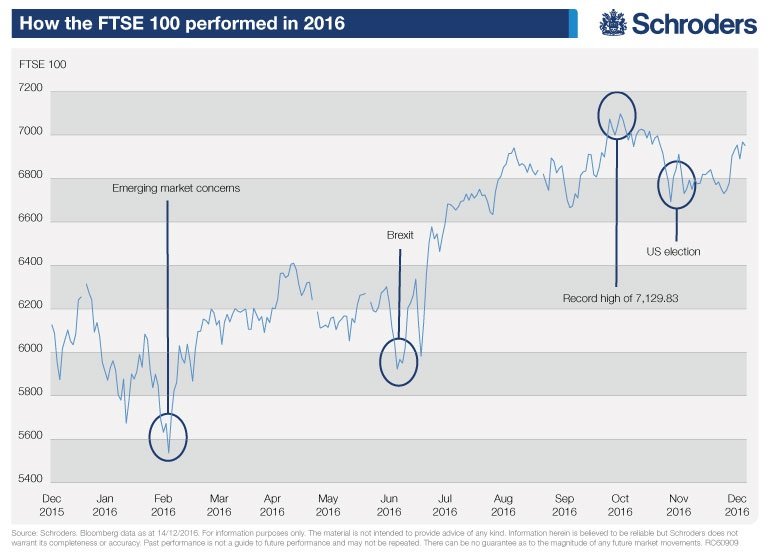
Why is the FTSE 100 near record highs?
Central banks continue to maintain their loose monetary policies. While they pump money into markets and keep interest rates low, it should support demand for shares. The Bank of Englandrestarted its quantitative easing programme, a form of electronic money printing, after the summer Brexit referendum verdict.
With rates low investors look for income on their money which their bank accounts and other investments can’t provide. FTSE 100 companies pay dividends, which provide an income, and the FTSE 100 has been one of the highest yielding major stockmarkets in the world.
So if you need income, and inflation at 1.2% is eating away at some of that income, you may be more tempted to put money into the UK stockmarket, which currently yields around 4%, than a government bond, which yields around 1.39%, for a 10-year gilt.
Fund manager view:
Marcus Brookes, Schroders Head of Multi-Manager, said:
“When investors come to review their equity market returns for 2016, I think they’re going to be quite happy. But where have these returns come from?
"Is it that we had better profits growth from companies? Well, actually, no – there was some disappointment over the course of 2016.
"Is it that we had better than expected economic growth? In fact, that’s not true either – economic growth looks like it’s going to come in somewhere near consensus was at the beginning of the year.
“So, where have these returns been generated? Well, our feeling is that this might be due to the end of a programme known as austerity.
"The vote in the UK for Brexit has brought in a different government with a different view on spending. Rather than having the austerity of George Osborne we now have Mr Hammond’s fiscal ease, although it’s only a small one.
“The returns we’re seeing today are possibly all about the growth for the future. Now, as we look at 2017, there’s an awful lot more politics coming and possibly some more changes of government.
"However it’s less likely, particularly in Europe, that they will have the same ability to spend more money, so perhaps returns will be slightly more difficult for 2017.”
- Test your investing ability: Income IQ test
- The Value Perspective: The FTSE 100 companies now offering 'deep value'
Why hasn’t the FTSE 100 risen higher?
It is impossible to say with any certainty how a myriad of investment factors move the market.
What we can say is that question marks hang over the outlook for the global economy, which in turn could affect the future performance of companies and prevent investors from putting more money into the stockmarket at current prices.
These global factors affect the FTSE 100 because they have a knock-on impact for the UK economy and because many of the companies are global businesses.
Questions include:
- How will rising interest rates in the US affect consumers’ demand for products?
- What impact will Brexit and a Trump presidency have on global trade?
- How will the return of inflation affect company profits?
- Can FTSE 100 companies sustain their dividend payments?
The final question appears to be a particular source of concern for investors.
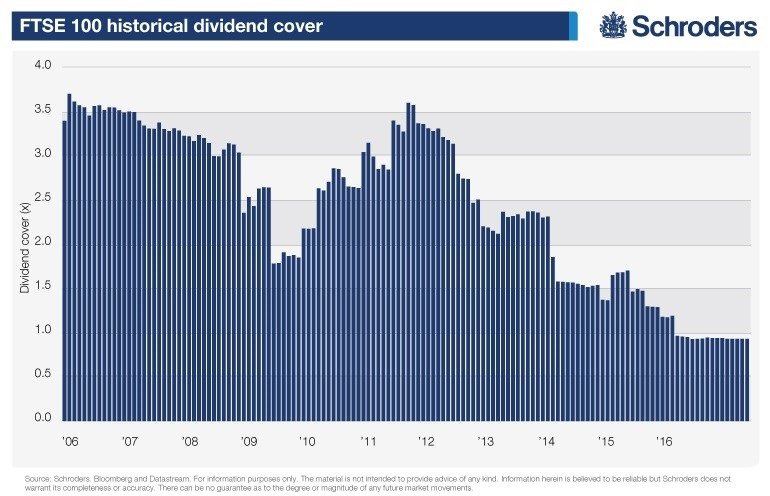
Dividend cover, which measures the ability of a company to pay dividends from cash generated by the business, has fallen dramatically since 2006.
A dividend cover of around two times, which means the company can cover its dividend twice over through its cash, is considered desirable. The FTSE 100 currently has a dividend cover below one.
Can the FTSE 100 go higher?
From a valuation perspective it looks like investors will need to choose wisely. The FTSE 100 as a whole currently trades on a price-to-earnings ratio of 16.8 times, compared with a long-term average of 14.9 times. The P/E ratio compares shares prices with profits, or earnings per share.
However, if you compare the price of the FTSE 100 to the value of the tangible assets (PTBV) on listed companies’ balance sheets –assets that they can physically value and sell if the company needed to urgently – they are still valued below their long-term average.
- Test your investing ability: Income IQ test
At the time of writing they are valued at 3.43 times their tangible book value, compared with the historical average of 3.76 times.
In fact the stocks on the FTSE 100 have not traded above their long-term average since 2009, during the global financial crisis.
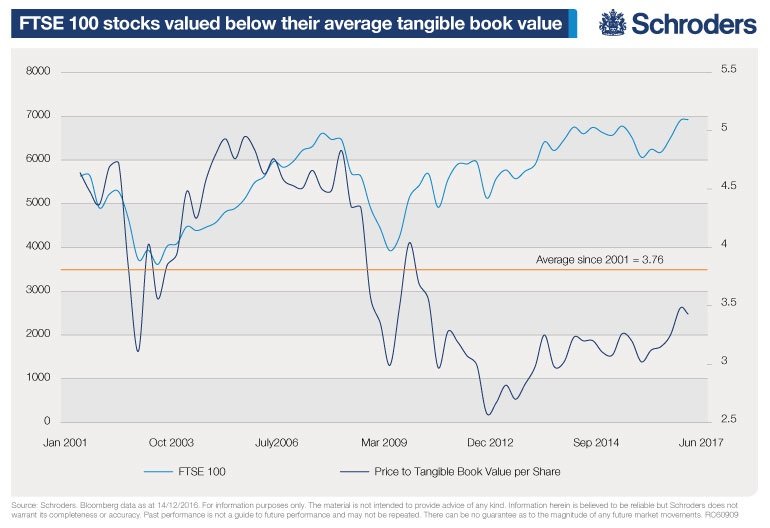
So, providing company earnings pick up then on a PTBV basis the FTSE 100 still looks cheap, although not as cheap as it was in 2011.
Which areas of the market look cheap?
Given the ever evolving nature of the FTSE 100 (companies drop in and out of the index every quarter depending on their value) it is easier to look at the UK market as a whole.
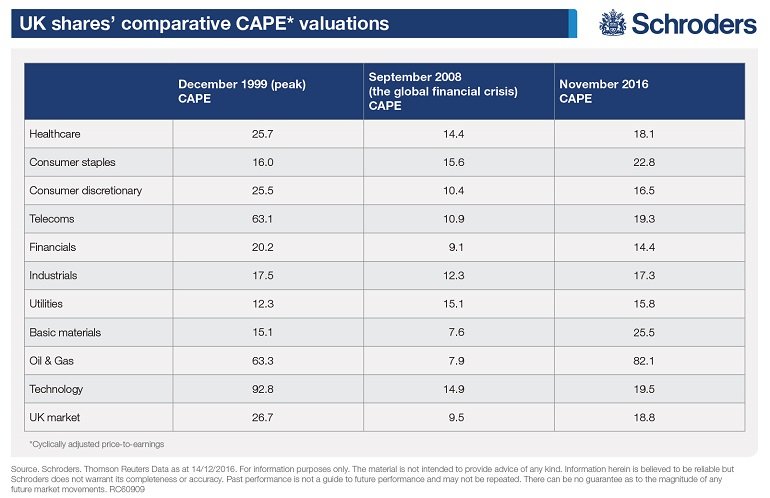
The following table looks at the cyclically adjusted price-to-earnings (CAPE) ratios.
This is similar to the price to earnings ratio but with the profits averaged over a decade to mitigate distortions caused by the usual cycles of the economy.
- Read more about value investing opportunities: The Value Perspective
What is the outlook for 2017 for UK stocks?
It could be difficult for the FTSE to break new ground given the uncertainty around the global economy but there are opportunities for stock pickers.
Fund manager view:
Matt Hudson, Head of Business Cycle Equity Team, said:
“Financials, including banks, are an area where we continue to find opportunities as we feel these could offer the best combination of attractive valuations and potential for earnings to further improve.
“If financial stocks are to continue to outperform we need to see an improvement in the fundamentals: specifically rising bond yields feeding through into a recovery in profit margins.
“Commodity cyclicals (stocks with revenues linked to a commodity product such as oil, steel, gas, mining or bulk chemicals) have been in recovery mode since early 2016 and we expect them to remain positive early into 2017 as balance sheets are repaired and nominal growth picks up.
“The most interesting, but challenged grouping is consumer cyclicals (revenues reliant on consumer spending), which have seen a 10-15% de-rating since June.”
Important Information: The views and opinions contained herein are those of David Brett, Investment Writer, and may not necessarily represent views expressed or reflected in other Schroders communications, strategies or funds. The sectors and securities shown above are for illustrative purposes only and are not to be considered a recommendation to buy or sell. This material is intended to be for information purposes only and is not intended as promotional material in any respect. The material is not intended as an offer or solicitation for the purchase or sale of any financial instrument. The material is not intended to provide and should not be relied on for accounting, legal or tax advice, or investment recommendations. Reliance should not be placed on the views and information in this document when taking individual investment and/or strategic decisions. Past performance is not a guide to future performance and may not be repeated. The value of investments and the income from them may go down as well as up and investors may not get back the amounts originally invested. All investments involve risks including the risk of possible loss of principal. Information herein is believed to be reliable but Schroders does not warrant its completeness or accuracy. Reliance should not be placed on the views and information in this document when taking individual investment and/or strategic decisions. The opinions in this document include some forecasted views. We believe we are basing our expectations and beliefs on reasonable assumptions within the bounds of what we currently know. However, there is no guarantee than any forecasts or opinions will be realised. These views and opinions may change. Issued by Schroder Investment Management Limited, 31 Gresham Street, London EC2V 7QA. Registration No. 1893220 England. Authorised and regulated by the Financial Conduct Authority.