Low rates, record high stocks: is the bubble about to burst?

The world is, seemingly, in a bull market in everything.
Just take a few headlines from this month alone: US stocks, already at all-time highs, hit a sixth consecutive closing high, which is the first time that has happened for 20 years. In debt markets, Ireland issued a bond with a negative yield, which means the country is effectively being paid to borrow €4 billion over five years.
Be it stocks, bonds, property, or cryptocurrencies, prices continue to rise. Fuelling the boom is ever cheaper debt and a general ability to access money more easily. Elsewhere, data shows that both companies and households are increasing leverage (borrowing).
Benjamin Graham, the father of value investing, said the secret of a sound investment is a “margin of safety”. What he meant by this was the price paid for an asset should allow for a range of unexpected adverse outcomes. Because many things can go wrong at once, it is prudent to be cautious. The actions of many market participants today tell us that many are becoming increasingly incautious.
Focus on the only thing that matters
While it is the nominal index level that makes headlines, it is far less important than valuation. The cyclically adjusted 10-year price-earnings ratio (CAPE) in the US currently stands at 30x. CAPE – or Shiller PE, named after Robert Shiller, who popularised it – measures the price of a company's stock relative to average earnings over the past 10 years.
CAPE's long-term average (the data goes back to 1881) is 17x. This indicates that today investors are willing to pay an unusually high price for a stream of profits.
For context, the US market CAPE has only reached its current highs twice before; during the dotcom bubble in 2000 (when it reached an all-time high of 44x) and in the build-up to the Great Crash of 1929 (when it peaked at 32x).
How do those that ignore the past justify paying high prices today?
“This time it’s different”. These are the four most dangerous words in finance, which may be a cliché, but they are being used to justify paying up for expensive stocks today.
To value the future earnings that you can expect from owning shares in a business, you must discount them using an interest rate. Today, “this time is different” echoes around the belief that real interest rates are expected to be lower for longer. That, as theory suggests, makes a future earnings stream more desirable and justifies higher prices for financial assets. This is how, in a low interest world, higher CAPE numbers are justified. However, paying higher prices causes those buying them to take on increasing risk, whether they recognise it or not.
A high CAPE doesn’t necessarily mean stocks are due a fall
CAPE is a mean-reverting phenomenon. From today’s elevated headline figure some infer that mean reversion implies an imminent correction to asset prices. While this is a possibility, historically a significant amount of the CAPE's mean reversion is realised by earnings catching up with stock prices, rather than the other way around. With global profit margins nudging all-time highs, we may question the likelihood of this. But irrespective, we can say with confidence that with valuations higher than average, returns are likely to be lower than the long-term average over meaningful time periods.
Where are we now? A detailed look at the UK market
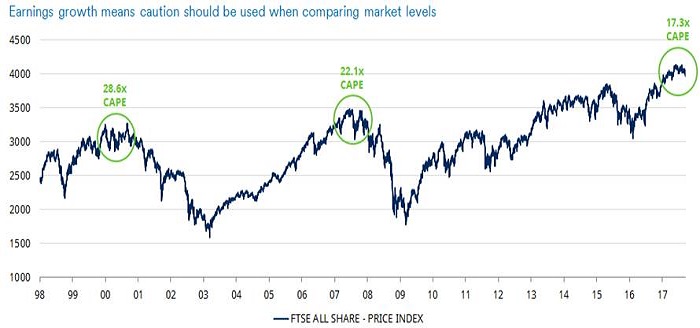
In aggregate, the UK market is not as expensive as the US market, but it is no longer cheap. The chart below shows the FTSE All-Share price index from 1998 to today, annotated with the CAPE at market peaks in green.

Past performance is not a guide to future performance and may not be repeated.
Seventeen years of earnings growth mean that, despite today’s index level being higher, valuations are not as overextended as they were in the dot-com bubble of 2000.
- 60 second video: the most attractive UK sectors
- Electric shock – finding the winners and losers of the electric revolution
At the year 2000 peak, the FTSE All-Share traded on a CAPE ratio of 28.6x, by the 2007 peak its CAPE was 22.1x, whereas today, despite the higher index level, its CAPE is 17.3x. This is above the 80-year (UK stockmarket data goes back to 1927) average of 11.4x. History suggests that, from today’s valuation level, the UK stockmarket could deliver inflation plus 3-4 percent per annum for equity investors over the next decade. This compares to inflation plus 7-8 percent over the very long term.
Extract the value premium to turbocharge investment returns
It is also crucial to point out that the market valuation is a simple average of the individual stocks within it and within those stocks there remain some attractive opportunities. It is these opportunities that could allow value investors to extract the c.2 percent p.a. potential premium return offered over and above the market itself, through focusing investment in the cheapest parts of the market.
Ensure you have a “margin of safety”
Dislocations have become extreme and we believe the market’s eventual snap-back to its typical function as an abitrator of value could be profound. Moreover, when higher asset prices are fuelled by debt, losses tend to be magnified.
History suggests that many investors could come to regret the high price they are paying for tech giants or bond proxies (stocks which have the yield characteristics of bonds) today.
Please remember that past performance is not a guide to future performance and may not be repeated. The value of investments and the income from them may go down as well as up and investors may not get back the amounts originally invested.
Important Information: The views and opinions contained herein are those of Nick Kirrage, Schorders fund manager, and may not necessarily represent views expressed or reflected in other Schroders communications, strategies or funds. The sectors and securities shown above are for illustrative purposes only and are not to be considered a recommendation to buy or sell. This material is intended to be for information purposes only and is not intended as promotional material in any respect. The material is not intended as an offer or solicitation for the purchase or sale of any financial instrument. The material is not intended to provide and should not be relied on for accounting, legal or tax advice, or investment recommendations. Reliance should not be placed on the views and information in this document when taking individual investment and/or strategic decisions. Past performance is not a guide to future performance and may not be repeated. The value of investments and the income from them may go down as well as up and investors may not get back the amounts originally invested. All investments involve risks including the risk of possible loss of principal. Information herein is believed to be reliable but Schroders does not warrant its completeness or accuracy. Reliance should not be placed on the views and information in this document when taking individual investment and/or strategic decisions. The opinions in this document include some forecasted views. We believe we are basing our expectations and beliefs on reasonable assumptions within the bounds of what we currently know. However, there is no guarantee than any forecasts or opinions will be realised. These views and opinions may change. Issued by Schroder Investment Management Limited, 31 Gresham Street, London EC2V 7QA. Registration No. 1893220 England. Authorised and regulated by the Financial Conduct Authority.