Ukip mapped: How UK immigration breaks down


Ukip seems set to run its 2015 General Election campaign on the back of the UK’s distrust of Europe and concerns about immigration.
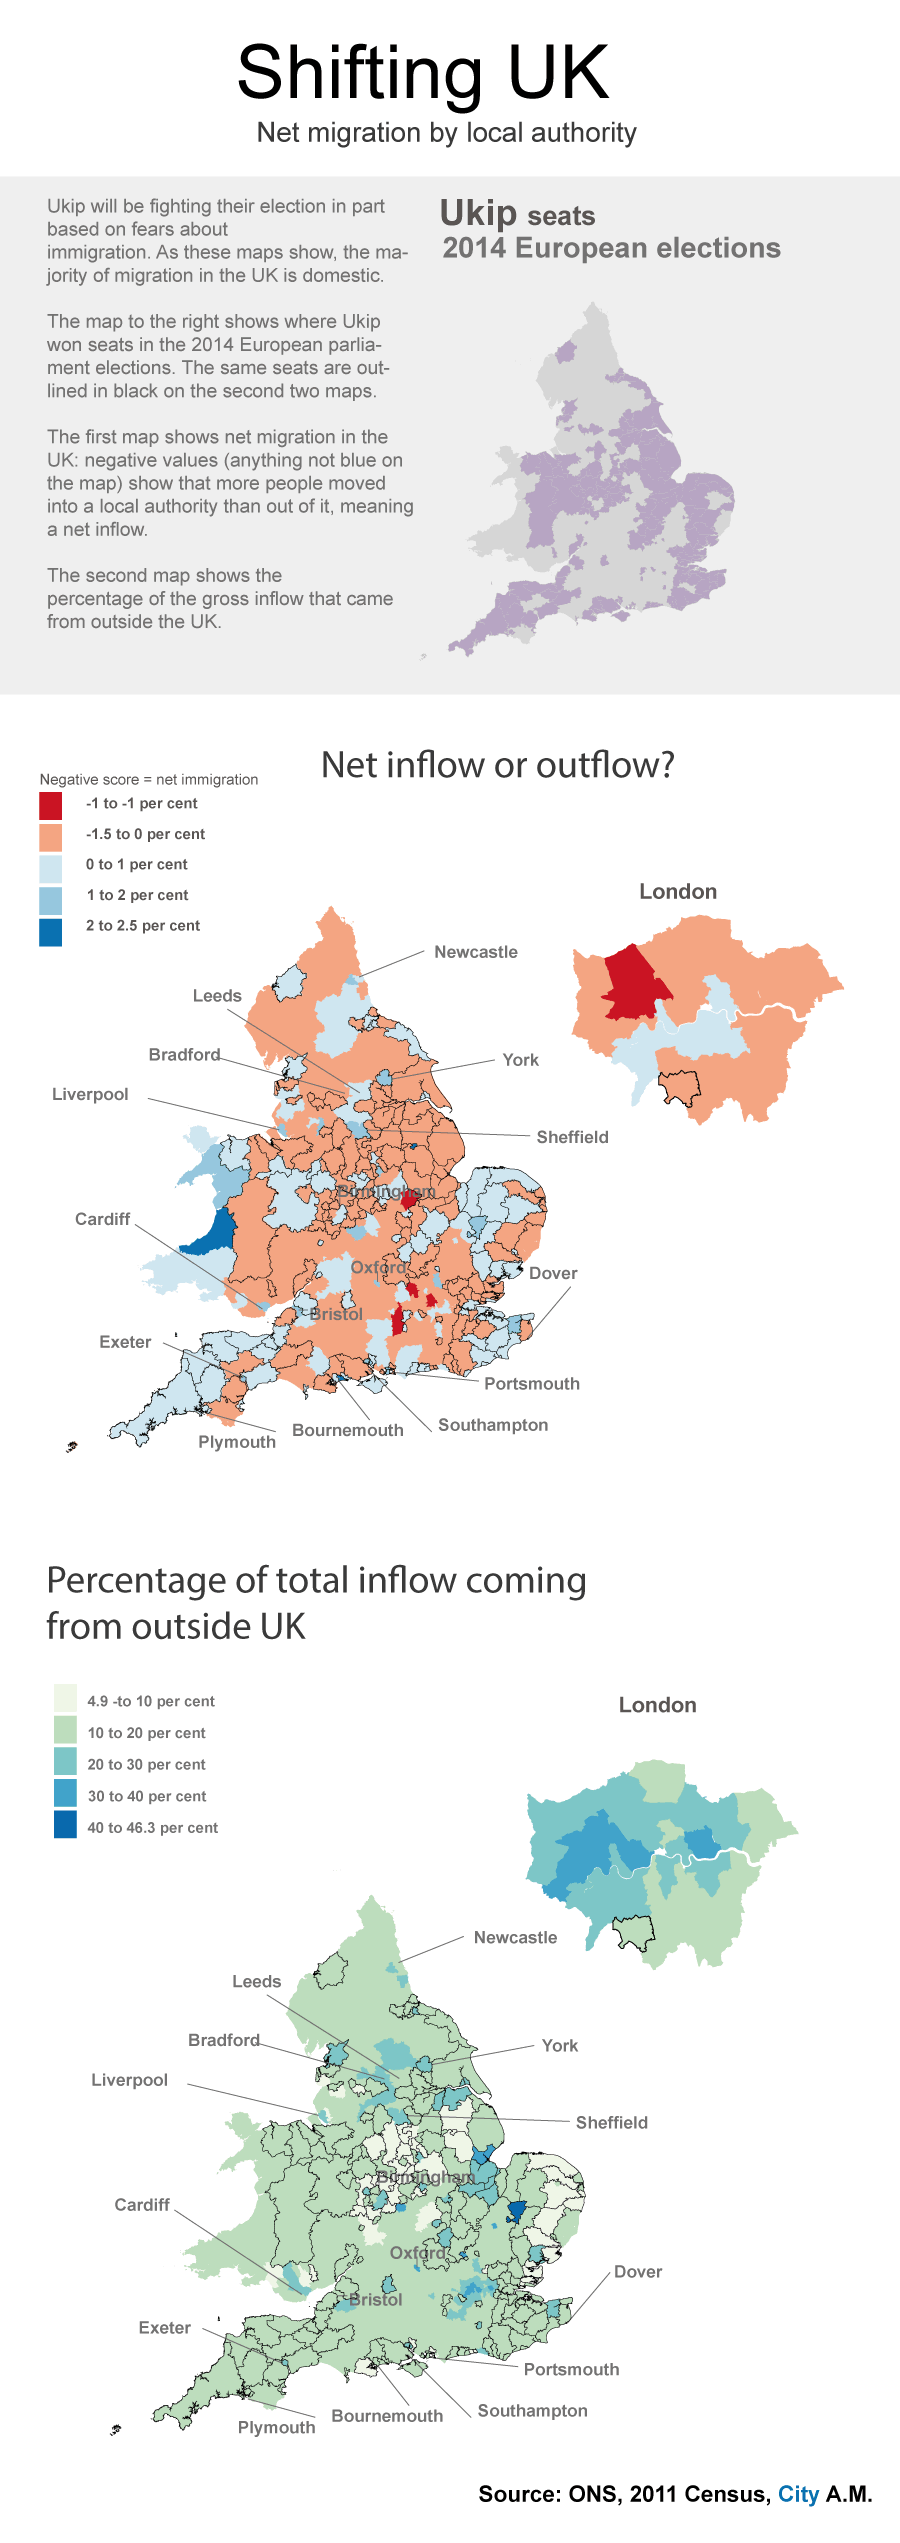
According to new analysis of 2011 census data by the Office for National Statistics, the vast majority of migration is domestic; residents move between areas far more often than they come from abroad. This may not be all that surprising to everyone, but it’s notable that your job may be more likely to come under pressure from a UK resident moving into an area than a person coming from abroad.
What is more, the areas Ukip won in the 2014 European elections, such as swathes of the south west, don't actually suffer from this problem at all – tending to see an outflow, possibly due to higher unemployment rates (see charts below), making them less attractive areas to stay in or move to.
These maps explore the data, showing where the net outflow (people moving out minus people moving in) is highest, and where the non-UK element of the gross inflow is proportionately highest.
All data, including that in the charts, is for people moving into a given area in the 12 months preceding the 2011 census.
As we can see from these charts, the unemployment rate varies by region, with the disparity likely to affect the rates of migration.
var margin = {top: 8, right: 10, bottom: 2, left: 10}, width = 200- margin.left - margin.right, height = 200- margin.top - margin.bottom;
var parseDate = d3.time.format("%b %Y").parse;
var x = d3.time.scale() .range([0, width]);
var y = d3.scale.linear() .range([height, 0]);
var area = d3.svg.area() .x(function(d) { return x(d.date); }) .y0(height) .y1(function(d) { return y(d.rate); });
var line = d3.svg.line() .x(function(d) { return x(d.date); }) .y(function(d) { return y(d.rate); });
d3.csv("https://www.cityam.com/special/d3/unemployment_regions.csv", type, function(error, data) {
// Nest data by region. var regions = d3.nest() .key(function(d) { return d.region; }) .entries(data);
// Compute the maximum rate per region, needed for the y-domain. regions.forEach(function(s) { s.maxrate = d3.max(s.values, function(d) { return d.rate; }); });
// Compute the minimum and maximum date across regions. // We assume values are sorted by date. x.domain([ d3.min(regions, function(s) { return s.values[0].date; }), d3.max(regions, function(s) { return s.values[s.values.length - 1].date; }) ]);
// Add an SVG element for each region, with the desired dimensions and margin. var svg = d3.select("#cam-map-immigration").selectAll("svg") .data(regions) .enter().append("svg") .attr("width", width + margin.left + margin.right) .attr("height", height + margin.top + margin.bottom) .append("g") .attr("transform", "translate(" + margin.left + "," + margin.top + ")");
// Add the area path elements. Note: the y-domain is set per element. svg.append("path") .attr("class", "area") .attr("d", function(d) { y.domain([0, 12]); return area(d.values)});
// .attr("fill", function(d) { d.values.color > 0 ? "#00ff00" : "#ff0000" });//
// Add the line path elements. Note: the y-domain is set per element. svg.append("path") .attr("class", "line") .attr("d", function(d) { y.domain([0, 12]); return line(d.values); });
// Add a small label for the region name. svg.append("text") .attr("class", "bolder") .attr("x", width - 6) .attr("y", height - 6) .style("text-anchor", "end") .text(function(d) { return d.key + " " + d.values[d.values.length - 1].rate.toFixed(1) + "%"; }) ; });
function type(d) { d.rate = +d.rate; d.date = parseDate(d.date); return d; }
Here are the areas with the greatest number of (net) migrants, from all sources, per 100 population.

As we can see, it’s not just the usual suspects. Top of the list for desirability is actually Ceredigion in Wales.
For gross numbers of people moving in from overseas, the top 10 is much more predictable. But some of the destinations imply wealth. A house in Westminster, for example, had an average asking price of £1.3m in December 2011 (the end of the year the census was carried out), while Kensington and Chelsea, top on the list, was even higher at almost £2m.

What the data implies is that fears about immigration may be misplaced, especially as a large volume of research has implied that immigration is beneficial to the economy.