Government backtracks on Covid death charts used to justify lockdown

The government has quietly replaced death rate projections that pushed England into its second national lockdown, after admitting the charts showed figures that were “too high”.
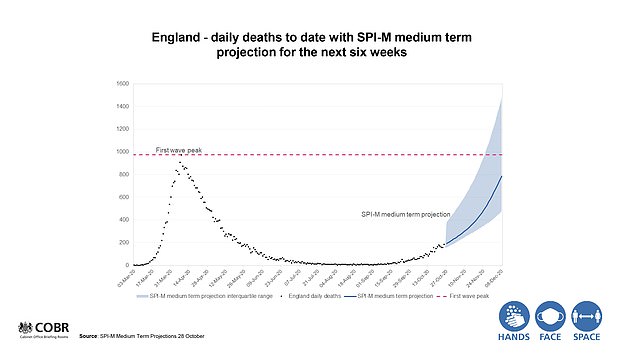
Graphs presented alongside new lockdown measures at the Number 10 press conference last Saturday predicted the UK would see up to 1,500 coronavirus-related deaths a day by early December.
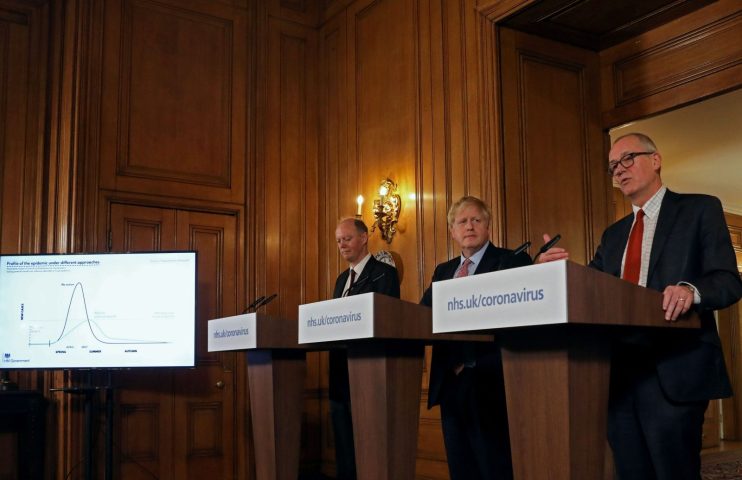
Chief scientific officer Sir Patrick Vallance said the figures painted a “very grim picture” for England over the winter, adding that they presented “greater certainty” than long-term modelling could provide.
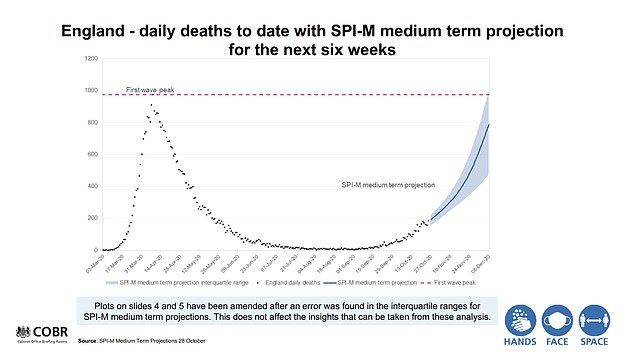
But those projections have now been watered down by the government to just under 1,000 deaths a day by early December, after documents emerged revealing they had been “amended after an error was found”, the Telegraph first reported.
The Government Office for Science today corrected two of the slides, reducing both the upper range for deaths and hospital admissions by one third.
The revised figures now suggest the second peak will likely be on par with the first with the worst-case scenario at 1,010 deaths a day by 8 December 8 — a similar figure to that seen in April.


It comes after former prime minister Theresa May this week grilled ministers over their use of statistics, questioning whether “figures are chosen to support the policy rather than the policy being based on the figures”.
Leading scientist Professor Carl Heneghan of Oxford University last night said the graphs presented over the weekend were found to be “riddled with errors”. He added that the push for a nationwide lockdown was “systematically” inflated.
The UK Statistics Authority today urged the government to make clear the source of data used in public briefings and the full figures behind it.
“The use of data has not consistently been supported by transparent information being provided in a timely manner,” the watchdog said.
“As a result, there is potential to confuse the public and undermine confidence in the statistics.
“It is important that data are shared in a way that promotes transparency and clarity. It should be published in a clear and accessible form with appropriate explanations of context and sources. It should be made available to all at the time the information is referenced publicly.”
Figures released today by the Office for National Statistics (ONS) showed new infections in England have stabilised at around 50,000 a day, suggesting a sharp hike in cases has begun to level off.
There were an estimated 45,700 new cases a day in the week to 31 October, down from the previous week’s estimate of 51,900.
“Incidence appears to have stabilised at around 50,000 new infections per day,” the ONS said.