Virus modellers must admit their mistakes and learn from the practice of transparency

By now, we all know about the poor track record of prediction by the academic modelling teams advising the Scientific Advisory Group for Emergencies – Sage. The unreliable nature of economic projections is also evident, as analysis of the Survey of Professional Forecasters (SPF) database shows.
Yet the epidemiologists could still learn from the experience of economic forecasters.
The SPF is a veritable mine of information on forecasts made for the American economy all the way back to 1968. It contains a very systematic record of the projections.
In comparison, the epidemic modelling community is many years behind. A key task for the epidemiologists would be to set up a similar kind of database with the projections they make. The SPF ensures a level of accountability, documenting the many errors made by economists over the years.
In terms of forecasts for a full year ahead, for example, the mean SPF forecast for the rate of growth of GDP has never once predicted a recession.
But of course, the closer a country is towards a recession approach, the greater the ability of economists to predict them. In this sense, it is not unlike a meteorologist forecasting a storm; once the thunderclouds are overhead, they certainly know about it.
This may seem a trivially easy thing. But some of the projections made for Sage have, incredibly, been seriously wrong even at the time they were published.
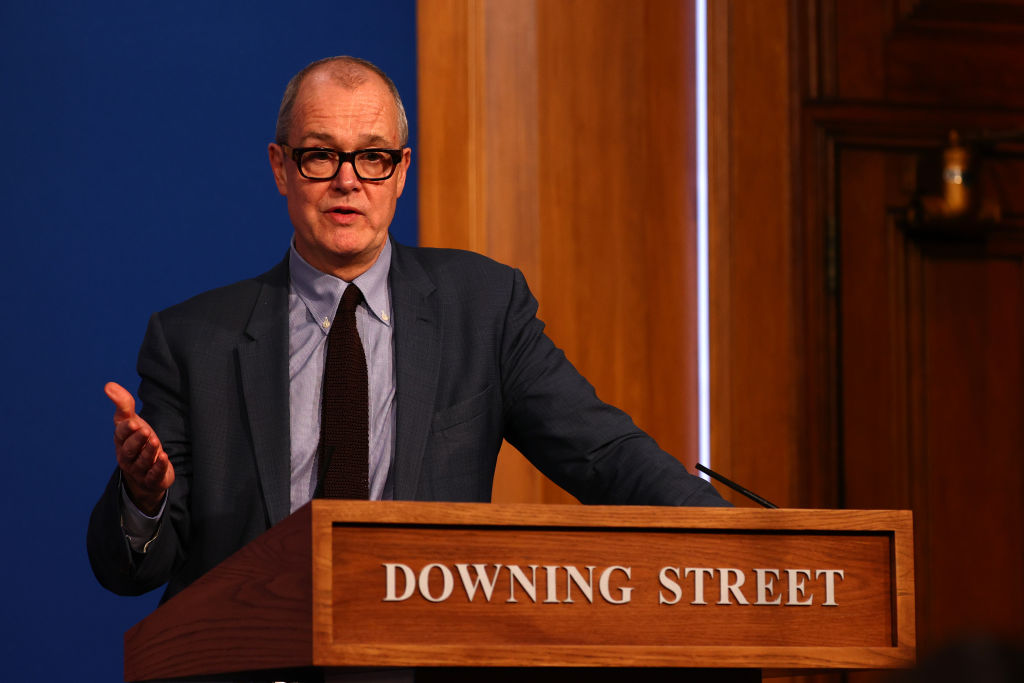
The most notorious example was the presentation given by Sir Patrick Vallance at the end of October 2020. He flourished a chart showing that there would be 4,000 deaths a day by the middle of December. The actual number was barely one-tenth of that.
Amazingly, the chart showed that on the day of the presentation itself – the modelling had been done some time before – 1,000 deaths a day were expected. The actual number was 265. It was wrong even on the day it was presented.
Last December, the UK Health Security Agency claimed there were 200,000 new Covid-19 infections a day. The true number was around 45,000.
The Covid-19 modellers try to excuse their inaccuracies by claiming they are not doing forecasts, merely generating scenarios. Economists were wise to this a long time ago. They will indeed often present scenarios, but they almost invariably indicate which one they think is the most likely. This is often called the “central” scenario.
In other words, they attach probabilities to the various scenarios.
But the virus modellers merely set out a wide range of scenarios, with no indication of how likely each one is. Or, if they do, the range is typically so wide that one would imagine at least one of the scenarios would almost always prove to be “correct”. But this is simply not the case.
According to documents released by Sage, they predicted that without stricter restrictions over the winter, there would be between 600 and 6000 deaths a day. A big range, clearly. But the actual peak was only around 300.
For over 40 years economic forecasters worked to understand the difference between models. This basic discipline seems to be absent in epidemiological circles.
The accuracy of economic forecasts still leaves a lot to be desired. But they have many lessons to teach the Sage modellers.
