Budget 2015 interactive: Friends of the north? Unemployment mapped in every constituency


On budget day, George Osborne offered a hand to the north of England. The Conservative party would, he said, build a Northern powerhouse, and, in fact they had already started.
Employment and jobs the chancellor added, have grown faster in the north of England than the south.
ONS tables comparing the three months to the end of January 2015 to the same period a year earlier backed up his claim.

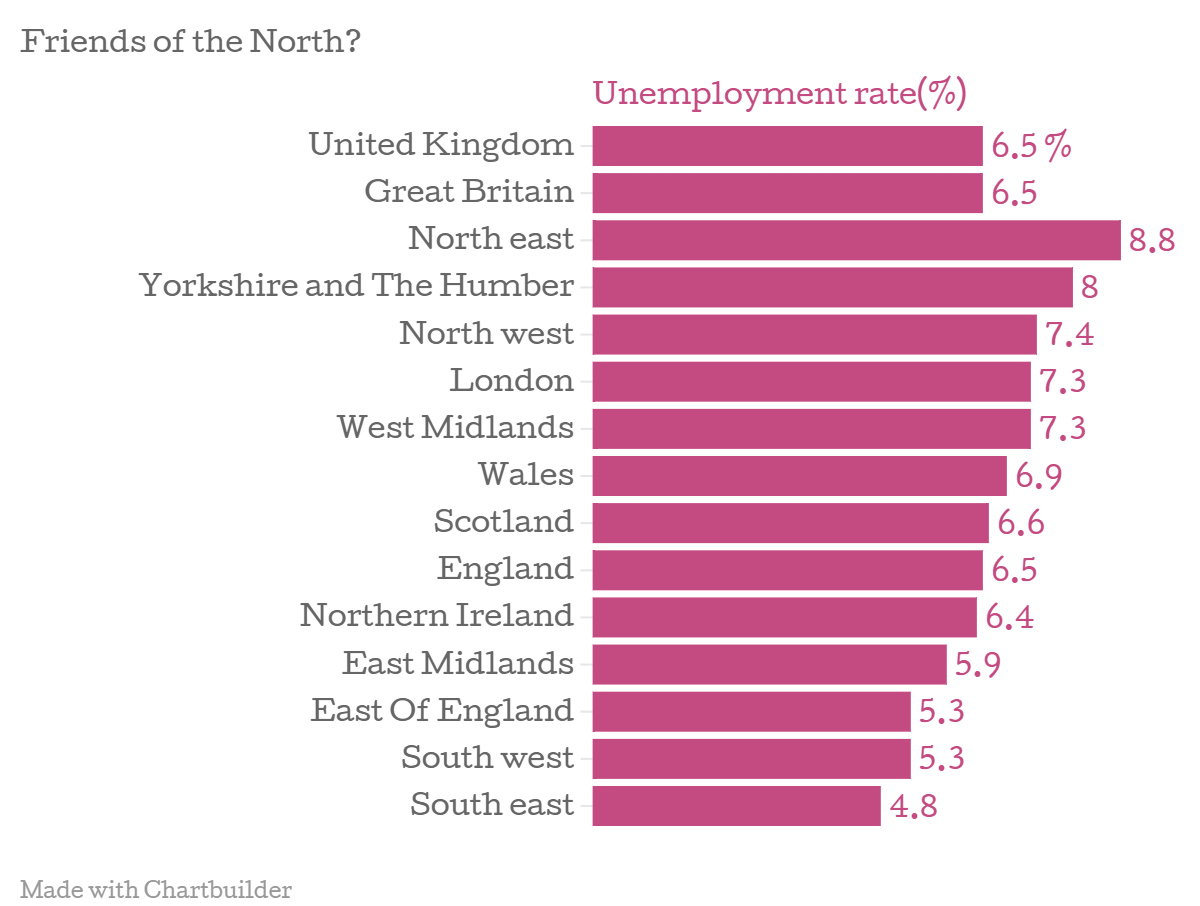
The faster drops could, however, be down to the fact that unemployment rates are generally higher in the north, as this map shows. The ONS data is from October 2013 – September 2014 and shows the unemployment rates by constituency. Blue constituencies are below the national average at the time (6.5 per cent).
During this period, the north was top of the class for high unemployment:

Ed Miliband’s response to the Tory claims was to say that the Conservatives have no friends in the north. That’s not quite true, but it is fair to say that Labour tends to do better in the cities. This map shows who won certain seats last time around, and what the unemployment rates (circles) looked like last October.
Northern highlights
The chancellor’s promises for devolution to the north appear to have been met with some disappointment. Leeds will be able to keep 100 per cent of growth in local business rates, and praised Greater Manchester’s decision to appoint an elected mayor.
The Tory’s plans will also include a scheme to invest £11m in technology hubs in Manchester, Leeds and Sheffield.
However, there were hopes that the deal would go further allowing for control of items such as health spending.