Best London areas to live: From schools to roads and care, this is where council tax takes you the furthest

As the cost of living crisis rages, energy bills are rising and inflation is biting harder than ever, the council tax rebate scheme was introduced to lift some burden off Brits’ shoulders.
However, with it still a significant cost, where in London and across the UK are residents getting the most in return for their council tax?
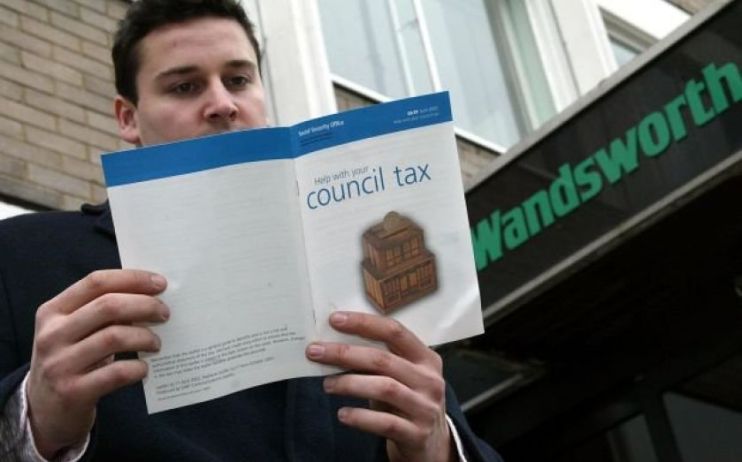
Council tax goes the furthest in Wandsworth.
With a final value score of 7.85/10, the fire brigade response time is the shortest (6.53 minutes), and 92 per cent of schools and social care homes are rated good or outstanding.
However, household waste management is below par with a recycling score of only 0.13/10.
| Rank | District | Road maintenance score (/10) | Household waste recycling score (/10) | Crime score (/10) | Fire service score (/10) | Education score (/10) | Social care score (/10) | Final value score (/10) |
| 1 | Wandsworth | N/A | 0.13 | 4.65 | 10.00 | 8.75 | 9.63 | 7.85 |
| 2 | Wigan | 9.61 | 8.80 | N/A | 8.47 | 7.07 | 8.29 | 5.03 |
| 3 | Windsor & Maidenhead | 5.62 | 7.96 | 6.47 | 7.50 | 9.83 | 5.75 | 4.88 |
| 4 | Westminster | N/A | 0.33 | 0.08 | 10.00 | 7.63 | 1.34 | 4.68 |
| 5 | Bromley | N/A | 4.62 | 5.89 | 10.00 | 9.79 | 8.83 | 4.63 |
| 6 | Merton | N/A | 4.11 | 6.43 | 10.00 | 9.34 | 8.83 | 4.53 |
| 7 | Bolton | 9.26 | 8.06 | N/A | 8.47 | 7.11 | 8.09 | 4.34 |
| 8 | West Berkshire | 9.06 | 7.59 | 8.02 | 7.50 | 8.99 | 9.77 | 4.32 |
| 9 | Kensington & Chelsea | N/A | 0.27 | 0.85 | 10.00 | 9.86 | 7.73 | 4.31 |
| 10 | Trafford | N/A | 8.16 | N/A | 8.47 | 9.09 | 3.85 | 4.30 |
Wandsworth came first out of research by money.co.uk, which analysed a variety of council services across England, including fire service response time, recycling levels, road conditions, crime rate, percentage of good or outstanding schools and care homes, to reveal in which district council tax goes the furthest.
Wigan comes in second place with a final score of 5.03/10. Road maintenance services are among the best in England (9.61/10) – only around 1 per cent of roads require repair.
Educational services and social care homes are also rated highly, scoring 7.07/10 and 8.29/10 respectively.
Windsor and Maidenhead
In third place is Windsor and Maidenhead with a final score of 4.88/10. Despite scoring just 5.75/10 for care homes, around 97 per cent of schools are rated as good or outstanding. Crime levels are also 83.4 per cent lower than in London.
50 per cent of the top ten districts in England are from Greater London.
Five out of the top ten English districts are in Greater London (Wandsworth, Westminster, Bromley, Merton, Kensington & Chelsea), with value scores averaging 5.02/10.
On the other hand, Greater Manchester sees three of its districts in the top ten (Wigan, Bolton, Trafford), averaging scores of 4.56/10.
Worst return in England
| Rank | District | Road maintenance score (/10) | Household waste recycling score (/10) | Crime score (/10) | Fire service score (/10) | Education score (/10) | Social care score (/10) | Final value score (/10) |
| 1 | Great Yarmouth | 2.66 | 1.20 | 0.81 | 1.67 | 2.37 | 0.13 | 0.76 |
| 2 | Norwich | 2.66 | 4.05 | 0.31 | 1.67 | 2.37 | 0.84 | 0.98 |
| 3 | Bradford | 0.78 | 2.78 | 0.19 | 7.13 | 0.63 | 0.70 | 1.13 |
| =4 | Redditch | 5.12 | 0.64 | N/A | 0.23 | N/A | 2.74 | 1.14 |
| =4 | Leicester | 1.72 | 1.94 | 0.43 | 4.93 | 3.38 | 1.34 | 1.14 |
| 5 | Liverpool | 0.35 | 0.47 | 0.27 | 8.13 | 2.72 | 2.74 | 1.15 |
| 6 | Stoke-on-Trent | 3.67 | 1.30 | 2.52 | 1.27 | 0.28 | 3.38 | 1.19 |
| 7 | Lincoln | 4.06 | 3.18 | 0.35 | 2.90 | 1.81 | 1.51 | 1.20 |
| 8 | Derby | 0.74 | 2.98 | 0.78 | 4.40 | 0.38 | 4.45 | 1.23 |