UK house prices in graphs: London sees 50pc rise in the number of high-end properties on sale

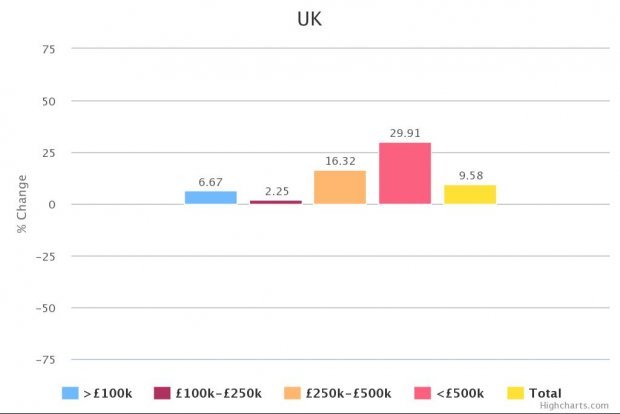
The number of homes entering the market at above £500,000 rose by almost 30 per cent in the UK and 50 per cent in London in the last 12 months.
According to research by Experian, houses between £250,000 and £500,000 rose by 16 per cent over the last year, putting volumes for both at their highest levels since 2010.
There was also a 9.6 per cent increase in the number of properties entering the market, suggesting that people are feeling financially stable enough to climb the property ladder.
According to Jonathan Westley, managing director of consumer information services at Experian UK and Ireland, the rise in prices shows that people are able to cash in on property values, but that the proportion of high-end properties implies it is second or third-time buyers who are benefitting.
What is especially interesting about the data is that while the majority of regions saw sales rise in general when compared to last year, those areas of the country with the highest prices – London and the South East – saw sales of cheaper properties fall, perhaps showing how quickly prices have risen in a year.
Figures out today from the ONS showed that house prices had risen 10.5 per cent in the 12 months to the end of May, and by over 20 per cent in London. The North West saw the number of properties entering the market at under £100,000 rising by 33.6 per cent.
Here are the new figures in graphs, broken up by region. The numbers are percentage changes on last year's figures – not the percentage of properties entering the market in a given price band.
|
|
|
 |
 |
 |
 |
 |
 |
 |
 |
 |
 |
 |
 |
