Here’s how we’re changing our spending habits in post-crisis Britain

(ONS)
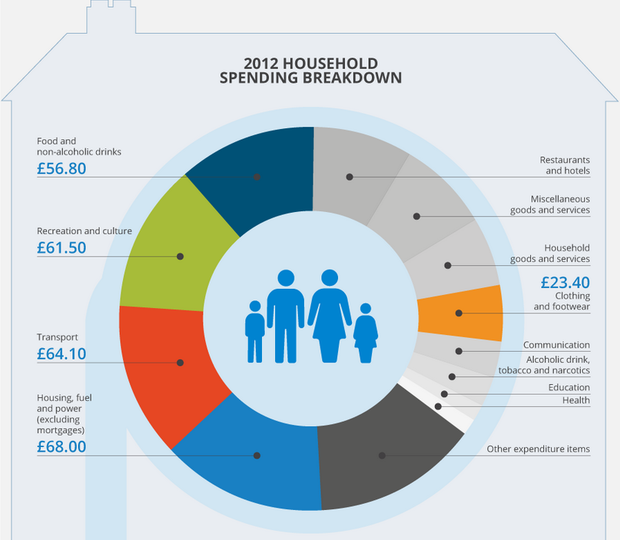
Latest figures from the Office for National Statistics (ONS) show that households spent an average £489 per week last year. They also show where we scrimped and splurged compared to pre-recession 2006, when average spend was £526.40.
(All 2006 and other pre-2012 figures are adjusted for inflation.)
Here are some interesting changes:
Housing, fuel, power
For the first time in recent years, housing, fuel and power spending overtook transport in 2012, accounting for £68 of total spend, up from £62.80 in 2006.
That figure includes rent, fuel, electricity and maintenance. The ONS said that energy price hikes and cold winters in 2011 and 2012 drove the increase.
Moreover, the proportion of households renting has risen in recent years from 29 per cent to 34 per cent.

Transport
Transport, which came in top in 2006 at £79.70, fell to £64.10 last year – the biggest spending reduction. With petrol prices on the rise, people probably shortened journeys. Spending on petrol and diesel accounted for almost two fifths of transport costs.
Entertainment
The category which saw the third highest spend includes spending on TVs, computers, newspapers, books and leisure activities. People forked out £61.50 a week on such things last year, up from £58.60 in 2006. The category also includes package holidays abroad, which accounted for £16.80 of weekly expenditure.
Food
When it comes to food and non-alcoholic drinks, we spent an average of £56.80 per week last year, down from £62.70 in 2006. Breaking last year's numbers down,£15.00 was spent on meat and fish, £4.20 on fresh vegetables, and £3.20 on fresh fruit.
Booze, clothes, cigarettes and shoes
Household spend on alcohol, tobacco and narcotics fell last year to £12.60. In 2006, it was £15.10.
We're spending more on clothes and shoes, though, despite the fact that the overall price of clothing has dropped. Average spend rose from £19.40 to £23.40 over the six years. In 2001/2 it was £15.30.
But people are tightening their purse strings when it comes to eating out and staying in hotels. Weekly spend fell from £47.50 per week in 2001/2, and £45.80 in 2006, to £40.50 in 2012. Spending on household goods and services also decreased from £35.70 in 2006 to £28.50 last year.