
Climate change tracker hits record low as progress gathers pace
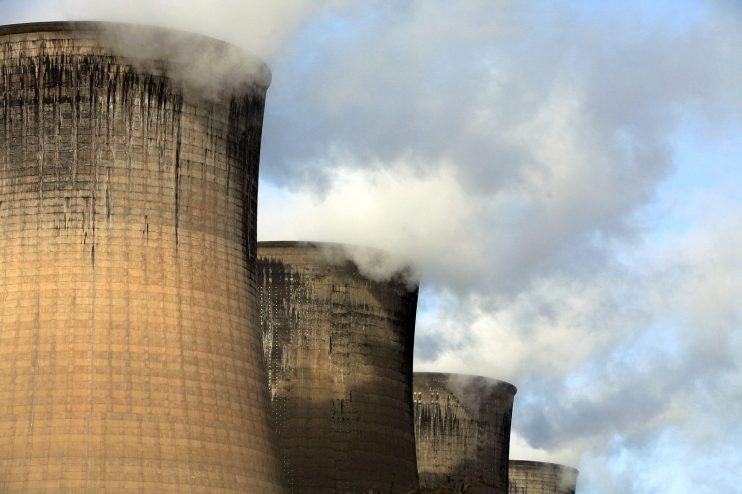
The current pace of progress will result in temperatures rising by 3.6°C above pre-industrial levels, events of the first quarter of 2021 suggest. The implied temperature rise last summer was 3.9°C. In this update Schroders’ Global Head of Sustainable Investment comments on changes in oil and gas investment and carbon pricing.
What is the Climate Progress Dashboard?
Climate change is becoming a defining theme of the global economy. We developed our Climate Progress Dashboard (CPD) in 2017 to provide an objective measure of the long-term temperature rises implied by changes to the levers global policymakers and companies can pull to tackle it.
The CPD tracks the rate of progress toward the commitments global leaders made in Paris in 2015 through examining areas from political ambition to renewable capacity. Today, 189 countries have joined the Paris Agreement, which aims to limit the global temperature increase in this century to 2 degrees Celsius while pursuing means to limit the increase even further to 1.5 degrees.
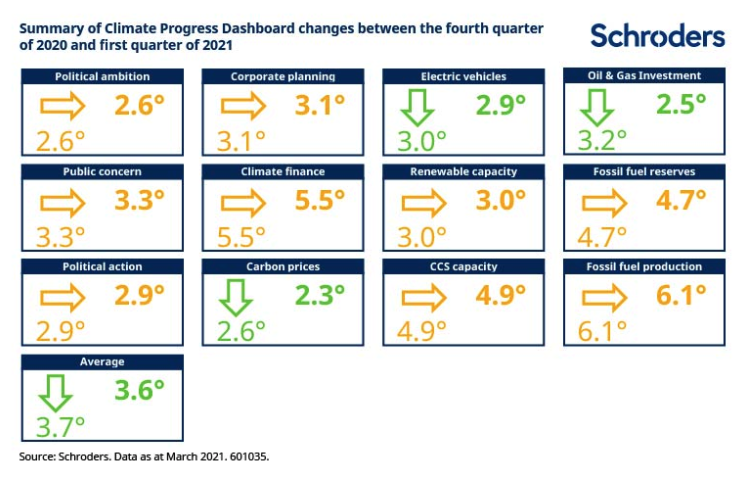
What does the latest Climate Progress Dashboard reading show?
The latest reading points to a long-run temperature rise of around 3.6 degrees above pre-industrial levels, down from the 3.7 degree rise recorded last quarter. Both this and the previous quarter’s readings have marked new lows in the temperature rises implied by the dashboard.
Although there is much further to go before the pace of change the dashboard implies comes into line with the “below 2 degrees” range, the signs of momentum are clear and encouraging.
Discover more from Schroders:
– Learn: An investor’s guide to climate change: the simple and surprising facts
– Read: This business was built on consumption. Now its primary focus is energy conservation
– Watch: The telecoms business which pioneered a payment system lifting thousands out of poverty
What next? COP26 and the 50% increase in Science Based Targets pledged by companies in the last year
We have said before that 2021 is likely to prove a pivotal year. The 26th Conference of the Parties (COP26) will be held in November, marking the fifth anniversary of the landmark meeting in Paris. COP26 was originally planned for 2020 but has been delayed due to Covid-related disruptions.
The conference aims to coordinate concrete action across countries to deal with the climate emergency, building on the commitments made in Paris and since. If successful, it can kickstart the sustained declines in global greenhouse gas emissions that will be needed to cut global emissions to zero over the next few decades.
As ever, the tone will be set in the run-up to the event over the next few months. We have already seen governments representing around 70% of global emissions or GDP commit to fully decarbonising their economies. The number of companies making similar Paris-aligned commitments through the Science Based Targets initiative has grown by around 50% over the last year and corporate focus on target-setting continues to gather pace.
That momentum is reflected in the moves we have seen in the Climate Progress Dashboard. For the last two quarters, the only movements in dashboard components have been toward lower temperature rises. Some measures rely on annual data that has not recently been updated and if these follow the direction of trends seen in more dynamic indicators the temperature implied will continue to fall.
Two impacts from the last quarter: falling oil and gas investment and carbon price increases
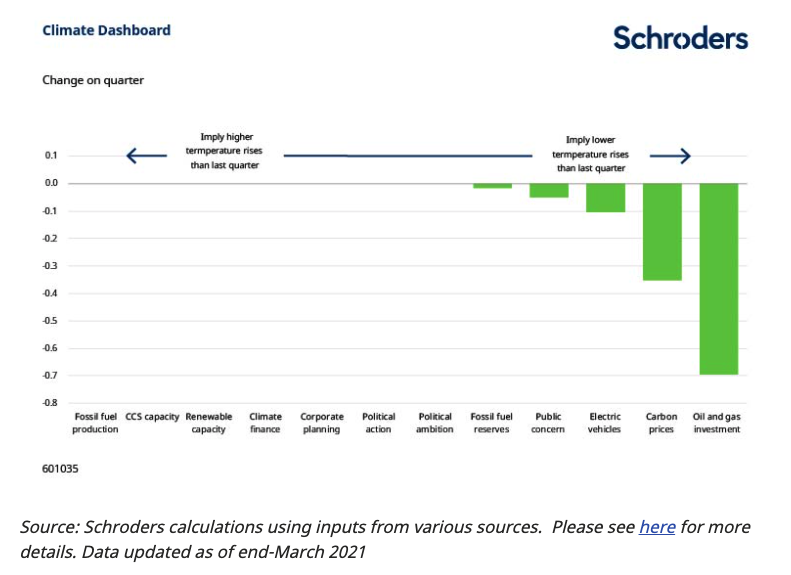
Over the last quarter, two areas have dominated the improving dashboard picture.
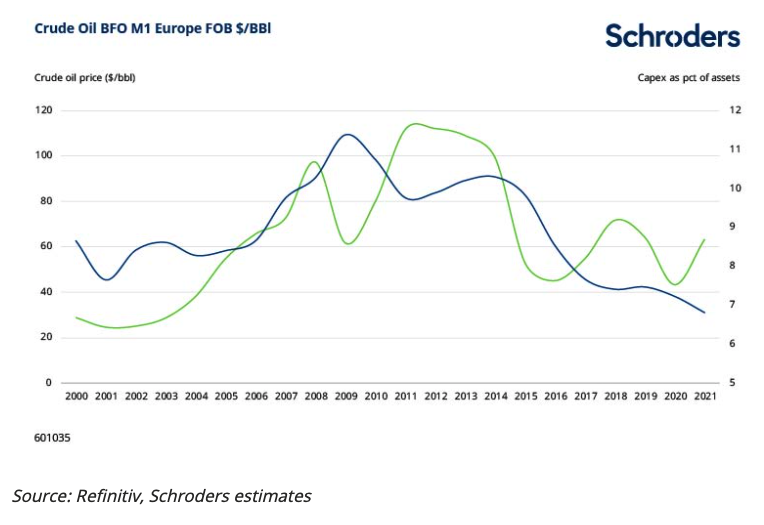
First, oil and gas investment has continued to drop relative to the industry’s assets. We examine the industry’s investment by comparing the capital investment of listed companies to their existing assets for an indication of the future growth implied by their spending. That ratio has declined consistently since early 2020, even as oil prices have staged recoveries.
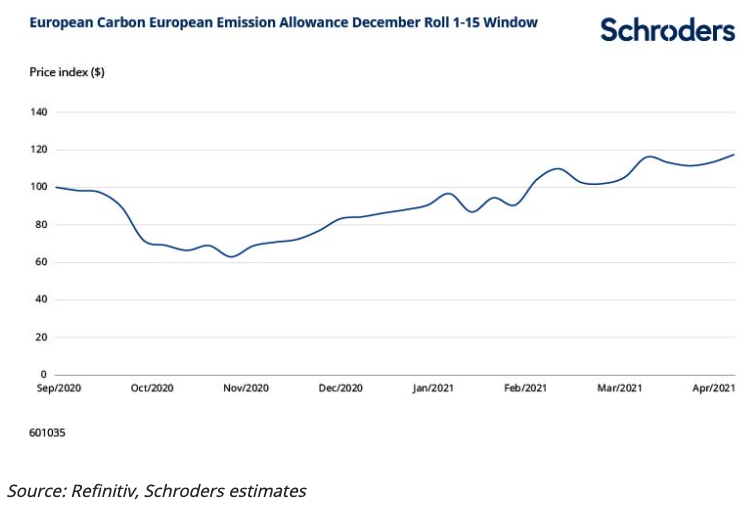
Second, carbon pricing in the key European Union Emissions Trading System (ETS) market, as well as the smaller US Regional Greenhouse Gas Initiative auctions, continues to rise.
The EU ETS, a cornerstone of the EU’s policy to combat climate change and the world’s first and biggest emissions trading scheme, has reached new highs, with prices of more than EUR40 per tonne of CO2 in recent weeks.
We believe higher prices will be needed – and across a larger share of emissions – to drive change on the scale and breadth needed to meet climate goals. The sustained rise in prices over recent years, despite plummeting industrial output, has demonstrated the resilience of the trend and the benefits of political action.
We are looking forward to the rest of 2021 and the months leading up to COP26 with excitement. Policymakers in most major economies have now spelt out their commitment to action. This has set the scene for co-ordinated global action that could underpin the sustained greenhouse gas emission reductions needed to put the global economy on track for decarbonisation.
Summary of changes
The chart below plots the changes in each indicator relative to the last update (Q1 2021).
– For more visit Schroders insights and follow Schroders on twitter.
Topics:
Important Information: This communication is marketing material. The views and opinions contained herein are those of the author(s) on this page, and may not necessarily represent views expressed or reflected in other Schroders communications, strategies or funds. This material is intended to be for information purposes only and is not intended as promotional material in any respect. The material is not intended as an offer or solicitation for the purchase or sale of any financial instrument. It is not intended to provide and should not be relied on for accounting, legal or tax advice, or investment recommendations. Reliance should not be placed on the views and information in this document when taking individual investment and/or strategic decisions. Past performance is not a reliable indicator of future results. The value of an investment can go down as well as up and is not guaranteed. All investments involve risks including the risk of possible loss of principal. Information herein is believed to be reliable but Schroders does not warrant its completeness or accuracy. Some information quoted was obtained from external sources we consider to be reliable. No responsibility can be accepted for errors of fact obtained from third parties, and this data may change with market conditions. This does not exclude any duty or liability that Schroders has to its customers under any regulatory system. Regions/ sectors shown for illustrative purposes only and should not be viewed as a recommendation to buy/sell. The opinions in this material include some forecasted views. We believe we are basing our expectations and beliefs on reasonable assumptions within the bounds of what we currently know. However, there is no guarantee than any forecasts or opinions will be realised. These views and opinions may change. To the extent that you are in North America, this content is issued by Schroder Investment Management North America Inc., an indirect wholly owned subsidiary of Schroders plc and SEC registered adviser providing asset management products and services to clients in the US and Canada. For all other users, this content is issued by Schroder Investment Management Limited, 1 London Wall Place, London EC2Y 5AU. Registered No. 1893220 England. Authorised and regulated by the Financial Conduct Authority.
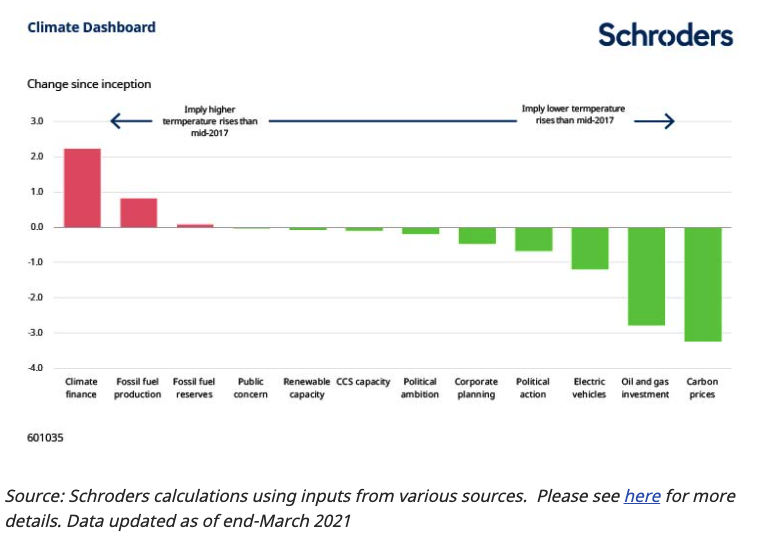
The chart below plots changes in each indicator since we launched the Climate Progress Dashboard in mid-2017.
– For more visit Schroders insights and follow Schroders on twitter.
Topics:
Important Information: This communication is marketing material. The views and opinions contained herein are those of the author(s) on this page, and may not necessarily represent views expressed or reflected in other Schroders communications, strategies or funds. This material is intended to be for information purposes only and is not intended as promotional material in any respect. The material is not intended as an offer or solicitation for the purchase or sale of any financial instrument. It is not intended to provide and should not be relied on for accounting, legal or tax advice, or investment recommendations. Reliance should not be placed on the views and information in this document when taking individual investment and/or strategic decisions. Past performance is not a reliable indicator of future results. The value of an investment can go down as well as up and is not guaranteed. All investments involve risks including the risk of possible loss of principal. Information herein is believed to be reliable but Schroders does not warrant its completeness or accuracy. Some information quoted was obtained from external sources we consider to be reliable. No responsibility can be accepted for errors of fact obtained from third parties, and this data may change with market conditions. This does not exclude any duty or liability that Schroders has to its customers under any regulatory system. Regions/ sectors shown for illustrative purposes only and should not be viewed as a recommendation to buy/sell. The opinions in this material include some forecasted views. We believe we are basing our expectations and beliefs on reasonable assumptions within the bounds of what we currently know. However, there is no guarantee than any forecasts or opinions will be realised. These views and opinions may change. To the extent that you are in North America, this content is issued by Schroder Investment Management North America Inc., an indirect wholly owned subsidiary of Schroders plc and SEC registered adviser providing asset management products and services to clients in the US and Canada. For all other users, this content is issued by Schroder Investment Management Limited, 1 London Wall Place, London EC2Y 5AU. Registered No. 1893220 England. Authorised and regulated by the Financial Conduct Authority.