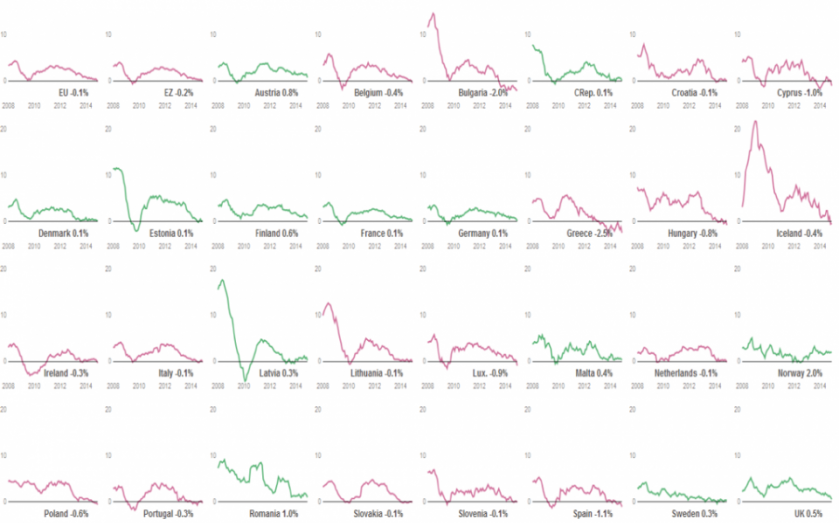
Interactive: 33 charts showing how UK inflation compares to every inflation rate in every EU country

Today was the day the UK hit the threshold: inflation fell to 0 per cent, its lowest since the current measure of inflation began in 1989.
More on this story: UK inflation falls to its lowest since records began
The fall was caused by dropping energy and food prices, fueled by the global oil-price slump and a supermarket price war. Analysts believe the UK will collapse into outright deflation in the next few months.
But in the Eurozone, where a lack of demand driven by high unemployment and low growth is threatening the bloc, deflation has already hit – although it is hoped the slide into deflation will be made shallower and briefer by the €1tn (£720bn) quantitative easing programme announced by the European Central bank. For now, here are the inflation rates of EU and Eurozone countries, with a couple of extras as well. Red lines indicate deflation and green inflation.
var parseDate = d3.time.format("%b %Y").parse, bisectDate = d3.bisector(function(d) { return d.date; }).left, formatValue = d3.format(",.2f"), formatPercent = function(d) { return formatValue(d) + "%"; };
var x = d3.time.scale().range([0, width]);
var y = d3.scale.linear().range([height, -8]);
var area = d3.svg.area() .x(function(d) { return x(d.date); }) .y0(height) .y1(function(d) { return y(d.rate); })
var line = d3.svg.line() .x(function(d) { return x(d.date); }) .y(function(d) { return y(d.rate); });
var base = d3.svg.line() .x(function(d) { return x(d.date); }) .y(function(d) { return y(d.base); });
var xAxis = d3.svg.axis() .scale(x) .orient("bottom") .ticks(4) .outerTickSize([0]) .innerTickSize([0]);
var yAxis = d3.svg.axis() .scale(y) .orient("left") .ticks(3) .outerTickSize([0]) .innerTickSize([0]);
d3.csv("/wp-content/uploads/2015/03/euroinflat-551185e091eff.csv", type, function(error, data) {
// Nest data by region. var regions = d3.nest() .key(function(d) { return d.region; }) .entries(data);
// Compute the maximum rate per region, needed for the y-domain. regions.forEach(function(s) { s.maxrate = d3.max(s.values, function(d) { return d.rate; }); });
// Compute the minimum and maximum date across regions. // We assume values are sorted by date. x.domain([ d3.min(regions, function(s) { return s.values[0].date; }), d3.max(regions, function(s) { return s.values[s.values.length - 1].date; }) ]);
// Add an SVG element for each region, with the desired dimensions and margin. var svg = d3.select("#cam-d3-euroinflation").selectAll("svg") .data(regions) .enter().append("svg") .attr("width", width + margin.left + margin.right) .attr("height", height + margin.top + margin.bottom) .append("g") .attr("transform", "translate(" + margin.left + "," + margin.top + ")");
// Add the area path elements. Note: the y-domain is set per element. svg.append("path") .attr("class", "area") .attr("d", function(d) { y.domain([-6.3, 23]); return area(d.values)}) .style("fill", function(d) { var current = d.values[d.values.length - 1].rate.toFixed(1); if (current d1.date - x0 ? bisectIndex : bisectIndex - 1; } return d.values[bisectIndex] } } });
function type(d) { d.rate = +d.rate; d.date = parseDate(d.date); return d; }