In 3 charts: Past performance is not an indication of future results
That famous phrase, “past performance is not an indication of future results,” is widely used in finance and for good reason.
Most investors who pile money into stocks of a particular country cite the long term economic growth prospects of these countries, pointing to the growth rates of previous years as an indication that now might be the time to invest.
But three charts published from Credit Suisse and the London Business School show how wrong this approach can be for investors trying to navigate the market.
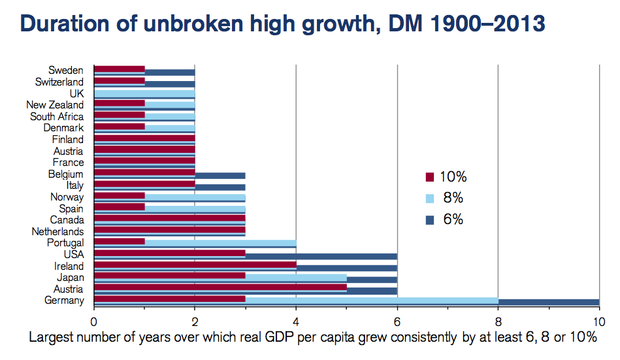
1. In economies around the world, there are remarkably few cases of high, unbroken growth

Investors only have a very short window of opportunity to capitalise on fast growing economies.
As this chart shows, high growth only occurs in short bursts and very few maintain a fast pace for very long. Apart from some anomalies, most countries grow quickly in very short bursts. After that, their growth slows.
2. There is no correlation of past GDP growth and future GDP growth

Investors may look at economic growth rates in 2013 and assume that this year will follow a similar path. This is the wrong approach.
If there was momentum in growth rates, the dots on this chart (all 2,000 of them) should plot along a diagonal line heading from bottom left to top right.
Instead, the dots land in no particular order, a sign there is no correlation between the two.
3. If you buy based on past growth you will underperform. If you buy on future growth you win

Ignore the complicated chart for a moment and look at the red bars on the right hand side.
This shows the value of clairvoyance in stock picking. If you can pick countries with the highest growth in future you will outperform all other strategies
Look at the dark blue bars to the left of this – buying countries which have grown quickly in the past.
his shows there is no evidence of outperformance by economies that have had prior red hot growth.