Three charts showing why we remain very happy to hold UK banks

Investors have tended to steer clear of the UK’s big banks since the financial crisis bit in 2008, when share prices plummeted and Lloyds and Royal Bank of Scotland (RBS) had to be bailed out with taxpayer money.
As we tend to do, on our Value Perspective blog, we took a different view – arguing things were not quite so dire for the sector and, ever so slowly, the wider market appears to be coming round to that view.
We are constantly revisiting and testing our investment thinking, however, and – with the ‘big four’ of Barclays, HSBC, Lloyds and RBS all publishing their company results for 2016 over the last few weeks – have just finished carrying out just such an exercise with the banks.
From that, we have produced three simple charts illustrating why we believe the risk-reward trade-off for the sector continues to look attractive.
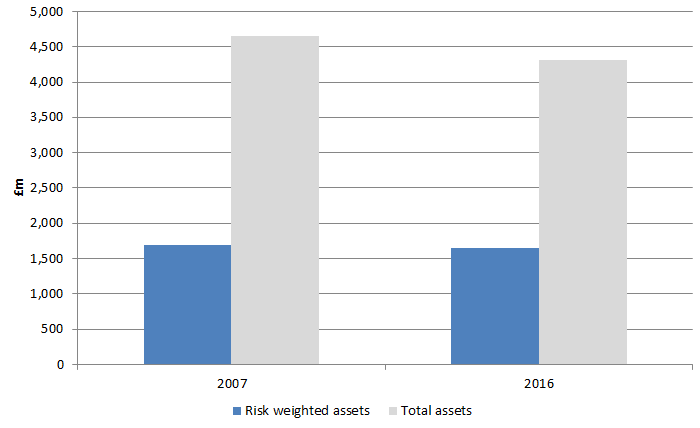
Our first chart compares the total assets of the big four as they stand now with how they were in 2007.
It does the same for the quartet’s ‘risk-weighted assets’ – a measure that attempts to gauge a bank’s real-world exposure to potential losses and is used to decide how much capital a bank should therefore set aside to reduce the risk of it going bust.

Source: Bloomberg 9 March 2017
Total assets and risk-weighted assets for the four actually peaked at £6.6 trillion and £2.1 trillion respectively but as you can see – and perhaps a little surprisingly – both figures are now broadly in line with where they were in 2007.
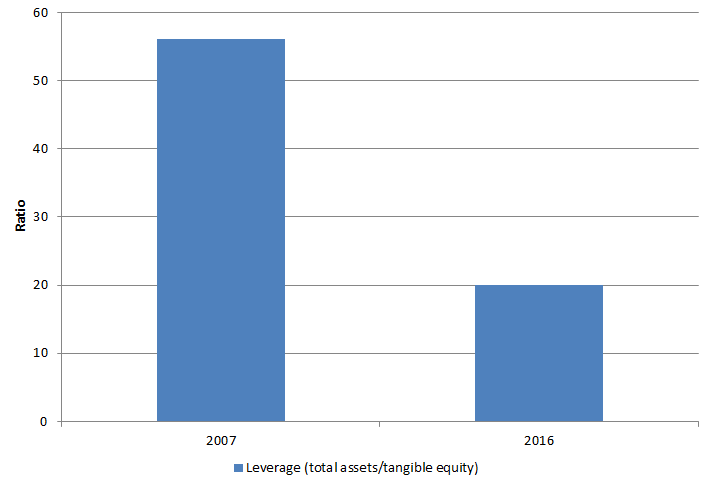
Much more importantly, however, as our second chart shows, the UK’s big four banks have significantly fewer liabilities – also known as ‘leverage’ – than they did just before the financial crisis.

Source: Bloomberg 9 March 2017
In common with other companies, banks rely on a mix of equity and debt to finance their business operations.
The higher a bank’s leverage ratio – calculated as its total assets divided by its tangible equity (which ignores ‘intangibles’, such as goodwill) – the weaker its balance sheet and the more vulnerable it will be to shocks such as the financial crisis.
As you can see, the ratio was 46x in 2007 but stands at a much healthier 18x now.
- A lesson for investors from the Battle of Agincourt
- Follow The Value Perspective: @Thevalueteam
So far, so good – but how is the wider market thinking about this equity, which is essentially supporting the banks?
After all, if it has recognised the banks have taken so much risk off their balance sheets, there would be less value in the share price and, consequently, on The Value Perspective blog, we would feel less comfortable about maintaining our positions. Still, it would appear we need not worry just yet.
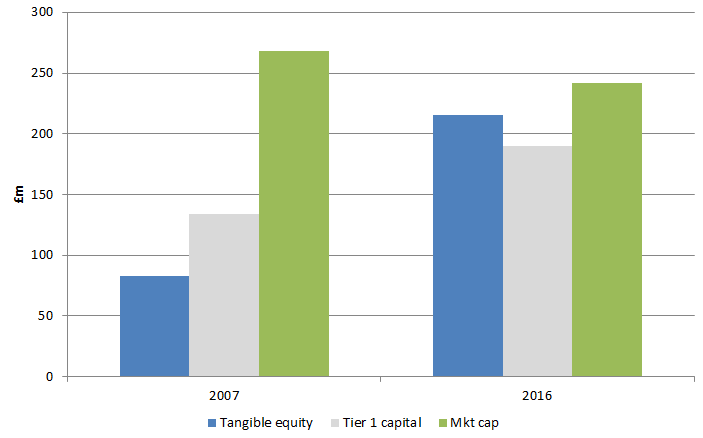
As we saw in the chart above, the risk associated with the UK’s big four banks has definitely reduced while, as our third and final chart shows, their tangible equity – which also happens to be another measure of a bank’s ability to deal with financial losses – has more than doubled.
Yet, as the following chart also shows, those four banks’ combined market capitalisation is exactly the same as it was in 2007.

Source: Bloomberg 9 March 2017
In other words, Barclays, HSBC, Lloyds and RBS have all been through a period of significant ‘de-risking’ – now holding a lot more equity relative to the liabilities on their balance sheets and the size of their businesses – and yet the market is giving them absolutely no credit for that whatsoever.
As such, we remain very comfortable with our exposure to the sector.
- Andrew Evans is an author on The Value Perspective, a blog about value investing. It is a long-term investing approach which focuses on exploiting swings in stock market sentiment, targeting companies which are valued at less than their true worth and waiting for a correction.
Important Information: The views and opinions contained herein are those of Andrew Evans Fund Manager, and may not necessarily represent views expressed or reflected in other Schroders communications, strategies or funds. The sectors and securities shown above are for illustrative purposes only and are not to be considered a recommendation to buy or sell. This material is intended to be for information purposes only and is not intended as promotional material in any respect. The material is not intended as an offer or solicitation for the purchase or sale of any financial instrument. The material is not intended to provide and should not be relied on for accounting, legal or tax advice, or investment recommendations. Reliance should not be placed on the views and information in this document when taking individual investment and/or strategic decisions. Past performance is not a guide to future performance and may not be repeated. The value of investments and the income from them may go down as well as up and investors may not get back the amounts originally invested. All investments involve risks including the risk of possible loss of principal. Information herein is believed to be reliable but Schroders does not warrant its completeness or accuracy. Reliance should not be placed on the views and information in this document when taking individual investment and/or strategic decisions. The opinions in this document include some forecasted views. We believe we are basing our expectations and beliefs on reasonable assumptions within the bounds of what we currently know. However, there is no guarantee than any forecasts or opinions will be realised. These views and opinions may change. Issued by Schroder Investment Management Limited, 31 Gresham Street, London EC2V 7QA. Registration No. 1893220 England. Authorised and regulated by the Financial Conduct Authority.