How simple rules can help avoid Piketty-style spreadsheet mistakes

Economist Thomas Piketty has come under attack today. And this time it's not for his ideas, but the quality of his spreadsheets.
The Financial Times' Chris Giles has gone through the data published by the French economist, and found a range of errors.
When corrected for, the picture of wealth inequality painted by Piketty changes, especially for the UK.
The errors presented by Giles – including fat fingers and formula errors – are by no means the first high profile mistakes of their kind. Used in the wrong hands, Excel can be dangerous. It's incredibly powerful, the downside of which seems to be that novices can make some awful mistakes.
Economists Reinhart and Rogoff found themselves corrected when their spreadsheets were reviewed by students attempting to duplicate their findings in May of last year. That mistake undermined their work on national debts and growth.
Faulty Excel practices also take a lot of the blame for JP Morgan's huge London Whale trades. Errors in a model designed to evaluate value-at-risk (VaR) likely had the effect of "muting volatility by a factor of two and of lowering the VaR".
These are largely human errors. JP Morgan's faulty VaR model included a formula which divided by the sum of two quantities, rather than their average, as the modeler had intended.
But such mistakes can be avoided, or at least the risks of making them can be minimised, by establishing good rules of spreadsheet practice.
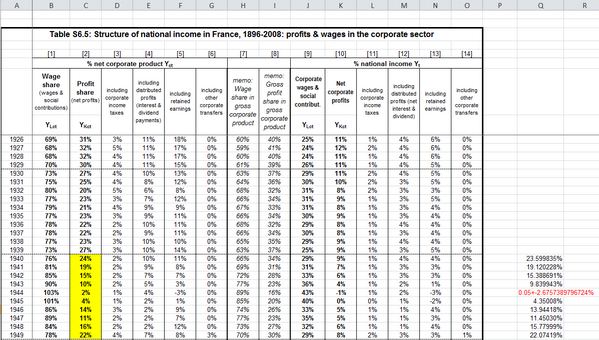
One huge problem with Piketty's spreadsheet work is in the way he adds adjustments. The unrounded values for the values in the yellow column below have been transplanted to the right. Note the inclusion of hardcoded adjustments.

Users shouldn't build spreadsheets relying on the idea that they'll make no mistakes. Such manual adjustments make it easier to mess up, and much harder to trace errors, let alone for someone to understand what's going on.
And that's why it's so important to establish consistent and simple formatting in your spreadsheets. If it's not obvious how steps are made, it can be incredibly difficult for others to review your work, and spot mistakes.
One way of doing this is to construct your sheets so that all calculations can be discerned from a print out of your file. Other basic steps include clear colour coding, so that cells performing different functions can be categorised clearly by their shade.