State Of The Bitcoin Network Q2 2020

Formal Verification is very excited to release its ‘In The Network: Bitcoin Q2 2020’ report today – an on-chain analysis of the current state of the Bitcoin network and the ecosystem that surrounds it. The article below highlights 5 key insights from the use of established and more exotic metrics.
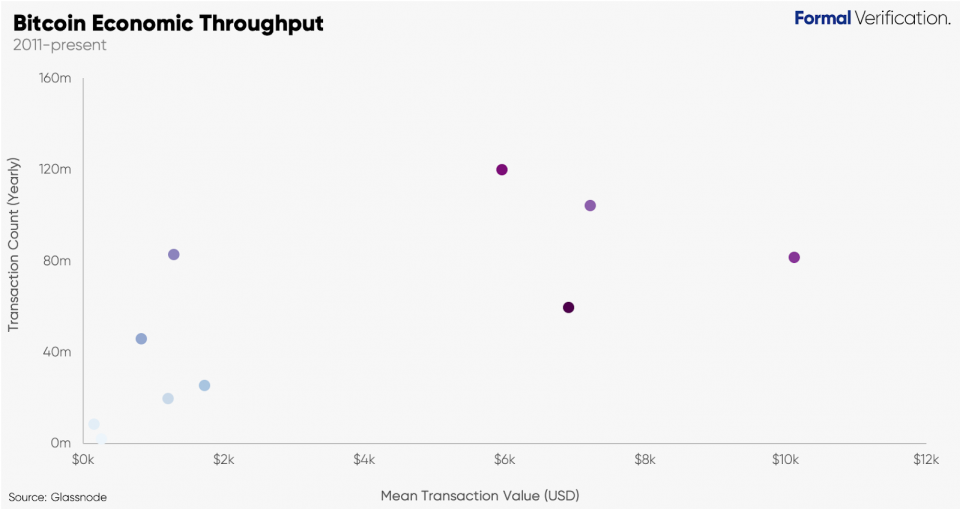
Studying the financial bandwidth is important when framing the Bitcoin network as a value-transfer system. One useful composite metric that we might find useful here is Economic Throughput. Economic Throughput is equal to the mean transaction value multiplied by the total transaction count over a certain period (e.g. a year). We can then identify how the nature of transactions that occur on the network change over the years which can inform us about what type value-transfer system Bitcoin is maturing into.
The Bitcoin network currently sees approximately $2.1 billion in economic throughput daily. What’s apparent when these two variables are plotted on a scatter is that Economic Throughput growth has been driven by both a rise in yearly transaction count and average transaction value. We might reasonably assume that, over time, Bitcoin might settle a lower number of higher value transactions through a continued usage of batched transactions, its fee dynamics, and its settlement assurance profile more generally.
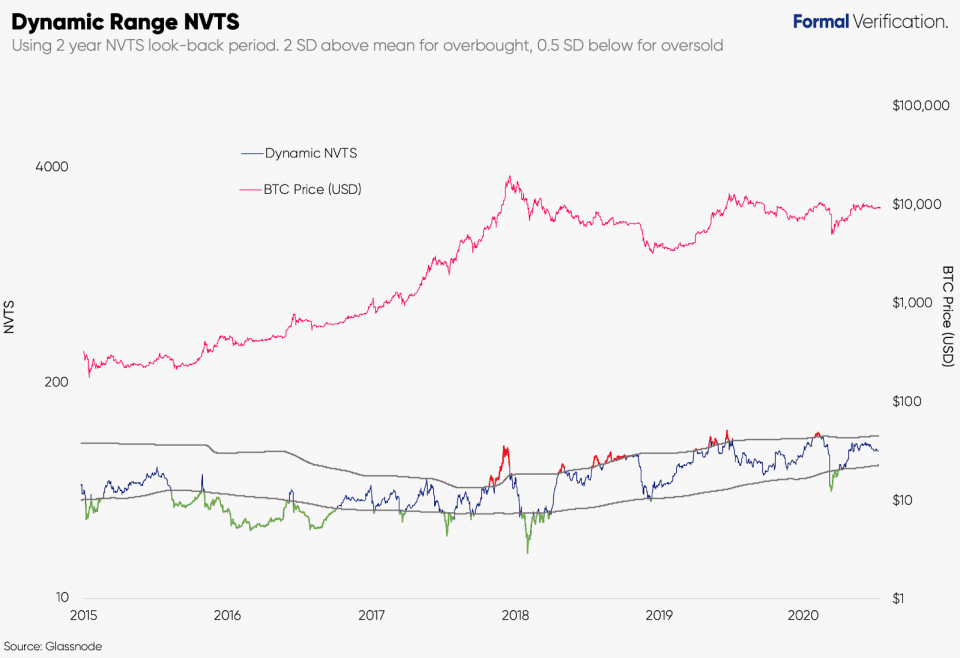
Well known ratios, such as the NVTS, values Bitcoin relative to how much utility is being derived from the chain – namely the transactional value being transmitted on the network. However, the increased usage of off-chain transactional activity might affect the validity of using static overvaluation/undervaluation thresholds. Therefore, using thresholds that can dynamically change over time might be more appropriate.
A recent alternative, the Dynamic Range NVTS, applies thresholds using standard deviations both above and below a long-term mean (e.g. 2 years). This approach allows us to account for an ebb and flow range of the NVTS ratio as Bitcoin matures as a network over time.
Because the original NVTS has historically been skewed, we should use a higher value (e.g. 2 SDs above the mean) to establish an overbought threshold and lower value (e.g. half a SD below the mean) for an oversold threshold. In Q2, the NVTS rebounded from its March lows and currently sits in the middle of both thresholds.
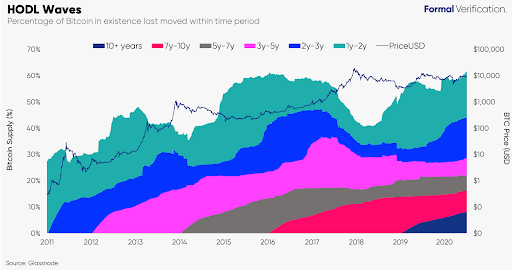
We can also study the accumulation behaviour of long-term holders through several UTXO-based metrics. HODL Waves is one that analyses the composition of BTC’s holder base by measuring the portion of Bitcoin’s supply that was last moved within a window of time (e.g. 1-2 years).
The total BTC supply that had not moved in more than 1 year has been steadily rising since early 2018 and climbed to a new ATH of 62%. Moreover, the percentage of the BTC supply that has not moved in more than 5 years is also at an ATH of 22%. This growth signifies a strengthening long-term investor base.
Another UTXO-based approach is to assign higher values to BTC supply that has been idle for longer in addresses. For example, Liveliness measures the ratio of Bitcoin Days Destroyed and the sum of all historical Bitcoin Days Destroyed. In other words, Liveliness decreases when more BTC units become dormant and increases when long-term holders move (and potentially liquidate) their positions.
By subtracting liveliness from one and multiplying this value by the circulating supply, we get a proxy for how many BTC units are held by long-term holders (as well as lost coins). In Q2, this number surpassed 7.4 million BTC which is the highest number seen since August 2017.
HODLer Net Position takes this one step further and measures the monthly change of these values – allowing us to see a more macro view of investor saving behaviour. Every month since August 2019 (with the exception of March this year) has shown net new positions being accumulated by investors. Q2 saw a 2.3x increase in positive position change (+176k BTC) than observed in the previous quarter (+76k BTC).
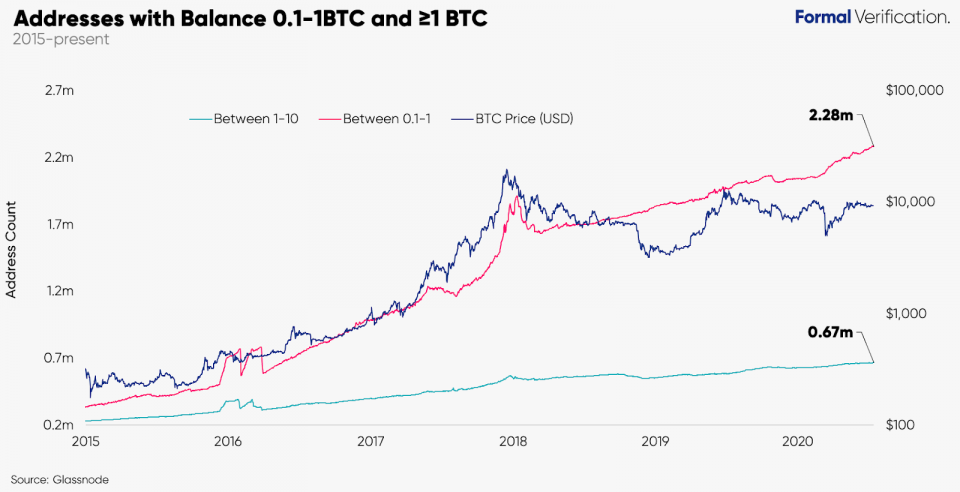
Measuring the distribution of addresses by balance can give further insight into Bitcoin’s holder base. One of the advantages of this metric is the difficulty in gaming it, particularly with the creation of wallets with higher balances.
Intriguingly, since the March 12th crash this year, the growth in the number of (retail) addresses holding between 0.1-1 BTC has accelerated slightly reaching new ATHs each month (currently ~2.28m addresses). This may potentially indicate certain opportunistic buying by retail investors in the market. Another area of notable growth can be seen with the 1-10 BTC bracket which has continued to reach new ATHs too (667k addresses).
It should be noted that wallet growth in Q2 this year has not been limited to smaller balance brackets. The number of addresses holding more than 1k BTC also grew 3% since the end of April reaching 2,150.
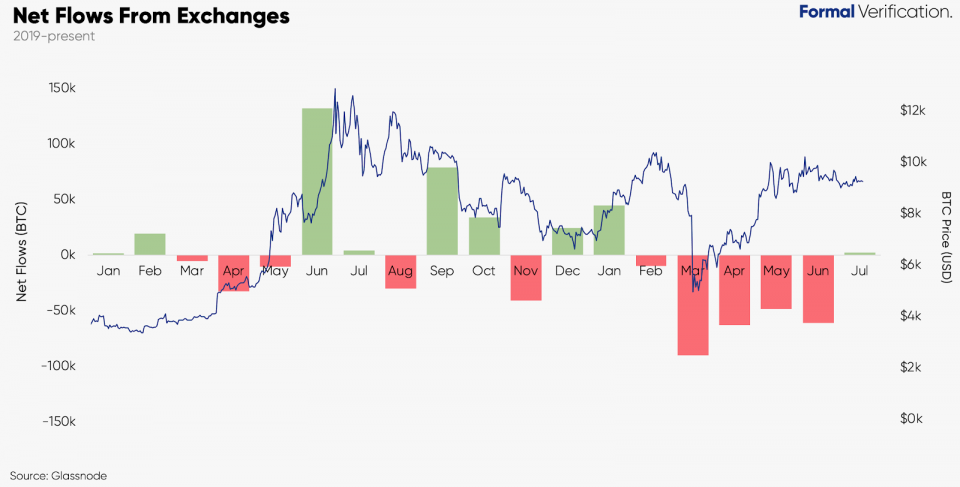
What makes this whale balance trend particularly interesting is that exchange-related wallets, identified by using certain statistical techniques, show an accelerated fall in the number of BTC held in those addresses. Specifically, net outflows in Q2 had 3x the net outflow than seen in the previous quarter.
While it is certainly possible that exchanges are simply dispersing large BTC holdings to new addresses, the growth in the number of >1k BTC wallets may also be reflective of simple accumulation by whale investors.
You can find the full In The Network Bitcoin Q2 report and analysis here.
Lewis Harland is the Founder of Formal Verification – a research and consultancy firm specialising in digital assets and distributed networks.