Four charts that show how badly the pandemic has hit UK jobs

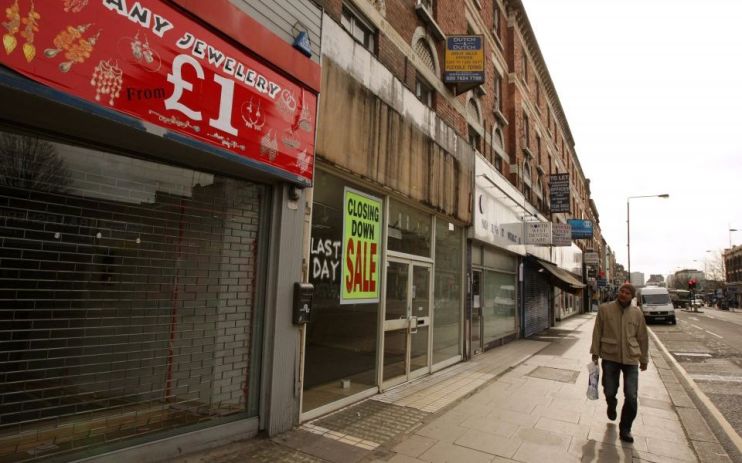
The largest number of people lost jobs in the UK in one quarter since the height of the financial crisis, official statistics showed today.
According to data from the ONS, 32.9m people aged 16 years and over are currently in employment, 220,000 fewer than the previous quarter.
That’s the single largest decrease since May to July 2009, during the previous financial crisis.
And experts say that the figures could yet get considerably worse as the government begins to wrap up its business support schemes.
Currently, the government’s job retention “furlough” scheme is covering 80 per cent of the wages of 9m workers, but this is due to end in October, which economists have warned could prompt a spike in the number of people out of a job.
Here are four other key takeaways from the data.
1. Number of hours worked crashes at record pace
Between January to March 2020 and April to June 2020, total actual weekly hours worked in the UK decreased by a record 191.3 million, or 18.4 per cent, to 849.3 million hours.
This was the largest quarterly decrease since estimates began in 1971, with total hours dropping to its lowest level since September to November 1994.
According to Jeremy Thomson-Cook, chief economist at Equals Money, the number of hours worked is the “best metric” for how the pandemic has actually affected the labour market.
He warned that the end of the furlough scheme would present a “cliff edge” for the market, and said the government would need to use stimulus to begin creating jobs.
2. Benefit claimants count surges
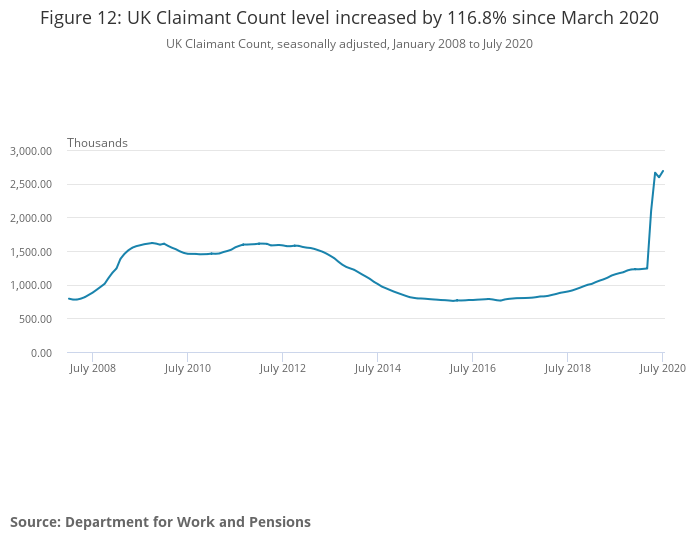
Between June and July, the claimant count – the number of people signed up for benefits – increased by 94,400 (3.6 per cent) to 2.7m.
Since lockdown began in March, the figure has increased by 116.8 per cent, or 1.4m in total.

Fiona Cincotta of City Index said that last month’s increase was way ahead of estimates of a rise of 10,000.
There had previously been a drop of 68,500 in June (to 2.6308 million) following large increases in May and April, when a combined 1.4m people signed up for benefits.
Cincotta said that the increases were because some of those who had been in the “no-man’s land of furlough” were beginning to appear in the statistics, a trend she said would continue over the coming months.
Before the Open newsletter: Start your day with the City View podcast and key market data
3. UK jobs vacancies rise from record low
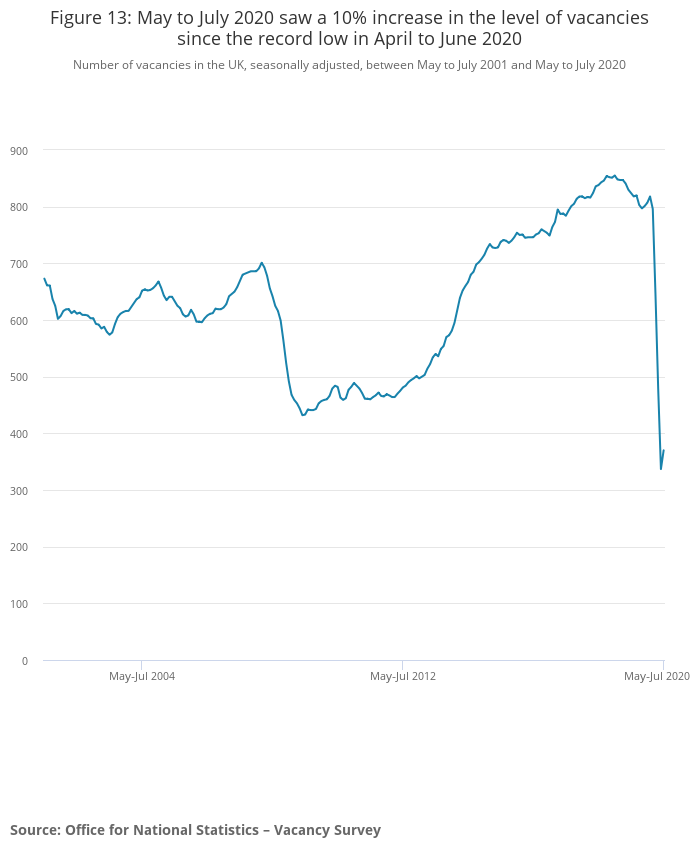
In one positive the number of vacancies did increase 10 per cent from the record lows of the April-June period, with 370,000 UK jobs available.

But jobs site Indeed’s global economist Jack Kennedy said that was 56 per cent lower than last year.
“Not only are there far fewer jobs today than there were last year or even in early 2020, the mix of available roles has shifted too, which means some of the jobs people search for simply are no longer there”, he said.
The ONS said that the increase was driven by small businesses (less than 50 employees), some of which reported taking on staff to meet coronavirus guidelines.
4. Coronavirus causes wages to shrink
In a further sign of trouble ahead, total pay dropped by 1.2 per cent in the three months to June, which translates as a two per cent fall in real terms.
The government’s furlough scheme dented the average earnings for UK jobs left as many as 9m workers being paid just 80 per cent of their salaries.
But economists warned today that wages are unlikely to grow once the pandemic passes.
“Annual earnings saw a further marked weakening in June and they look set to remain under pressure over the coming months,” Howard Archer, chief economic adviser to the EY Item Club, said.
“Looking ahead, many companies are looking to freeze or cut pay, and to reduce bonuses.”