Airspan Networks and Atika Form Alliance to Advance Resilient Multi-Domain 5G Connectivity for Defense
Airspan Networks Holdings LLC (“Airspan”), a leading global provider of wireless network solutions and ATIKA Venture, S.L. (“Atika”), a Spanish technology company specializing in deployable tactical 5G communications for defense and security environments, today announced a strategic alliance to advance resilient, multi-domain 5G connectivity solutions for military operations.
The agreement establishes the framework for commercial and technical collaboration, initially focused on Spain and potential expansion across Europe. The partnership brings together Airspan’s expertise in Open RAN (O-RAN), 5G, and commercial air-to-ground (ATG) connectivity with Atika’s capabilities in deployable tactical networks, AI-driven network intelligence, and 5G core technologies.
Together, the companies will develop secure, resilient communications solutions designed to support mission-critical operations across land and air environments. The collaboration will integrate deployable 5G networks, multi-domain MANET connectivity, intelligent network orchestration, and airborne-to-ground communications, enabling high-performance connectivity for military units operating in dynamic operational scenarios.
“Airspan brings proven expertise in solving complex connectivity challenges, including critical communications through our Air-to-Ground In-Motion 5G solution,” said Glenn Laxdal, CEO of Airspan. “Together with Atika, we will accelerate the transition of our commercial wireless technologies into resilient, defense-ready solutions. Atika complements our capabilities with deep defense operational experience and advanced technologies spanning cybersecurity, AI-driven network intelligence, and 5G core systems.”
“The future of military operations depends on deployable, intelligent, and sovereign networks,” said Ana Rodríguez Quirós, Managing Director of Atika. “Our collaboration with Airspan allows us to support multi-domain 5G for defense while extending connectivity beyond satellite and traditional radio links. Through our work with the Spanish Army, we focus on technologies that deliver real operational impact across readiness, mobility, and mission effectiveness. This alliance is a clear example of how advanced 5G capabilities can address those challenges.”
About Airspan
Headquartered in Plano, Texas, Airspan Networks Holdings LLC is an innovative US-based provider of wireless network solutions with a global presence, focused on delivering carrier-grade 5G and advanced wireless connectivity. Airspan’s portfolio spans three core solution areas – in-building, outdoor, and air-to-ground – and includes market-leading products for DAS, Open RAN, and small cells across both public and private network settings. Airspan supports mobile network operators, neutral-host providers, enterprises, public-sector organizations, and other service providers in building reliable, scalable wireless networks that enhance coverage and capacity while enabling fast, efficient deployment.
Visit our website at https://airspan.com/
About Atika
Atika is a Spanish technology company specializing in advanced tactical communications and deployable 5G networks for defense and security. Its technology focuses on federated architectures, multi-domain connectivity, and network intelligence capabilities designed for real operational environments.
View source version on businesswire.com: https://www.businesswire.com/news/home/20260319340548/en/
Contact
Media & Analyst Contact:
Kyle Allen
kallen@airspan.com

Morocco’s FRMF Welcomes CAF Appeal Board as Upholding Rules, Stability of International Competitions
Following the announcement by the CAF Appeal Board, the Royal Moroccan Football Federation (FRMF) welcomes the decision, which reaffirms the primacy of competition regulations and reinforces the conditions necessary for the proper conduct of international tournaments.
From the outset, following the incidents that led to the interruption of the match, the FRMF maintained a clear and consistent position: the strict application of the governing regulations. The Federation’s approach was solely guided by this principle.
Following its appeal, CAF has now confirmed that the applicable regulations were not properly enforced.
Throughout the process, the FRMF acted in full compliance with all relevant legal and procedural frameworks, with a constant focus on upholding its rights and preserving the integrity of the competition.
This decision provides clarity on the applicable framework and strengthens the consistency and credibility of international competitions, particularly within African football.
The FRMF remains committed to the consistent and fair application of competition regulations across all continental and international bodies. It now turns its focus to the upcoming sporting calendar, including the FIFA World Cup and the Women’s Africa Cup of Nations scheduled for this summer.
The FRMF also commends all participating nations in this year’s Africa Cup of Nations (AFCON), which once again highlighted the strength and dynamism of African football.
Source: AETOSWire
View source version on businesswire.com: https://www.businesswire.com/news/home/20260319152379/en/
Contact
FRMF
Omar KHYARI
+212-661-435843
Abstract
Morocco’s FRMF Welcomes CAF Appeal Board as Upholding Rules, Stability of International Competitions
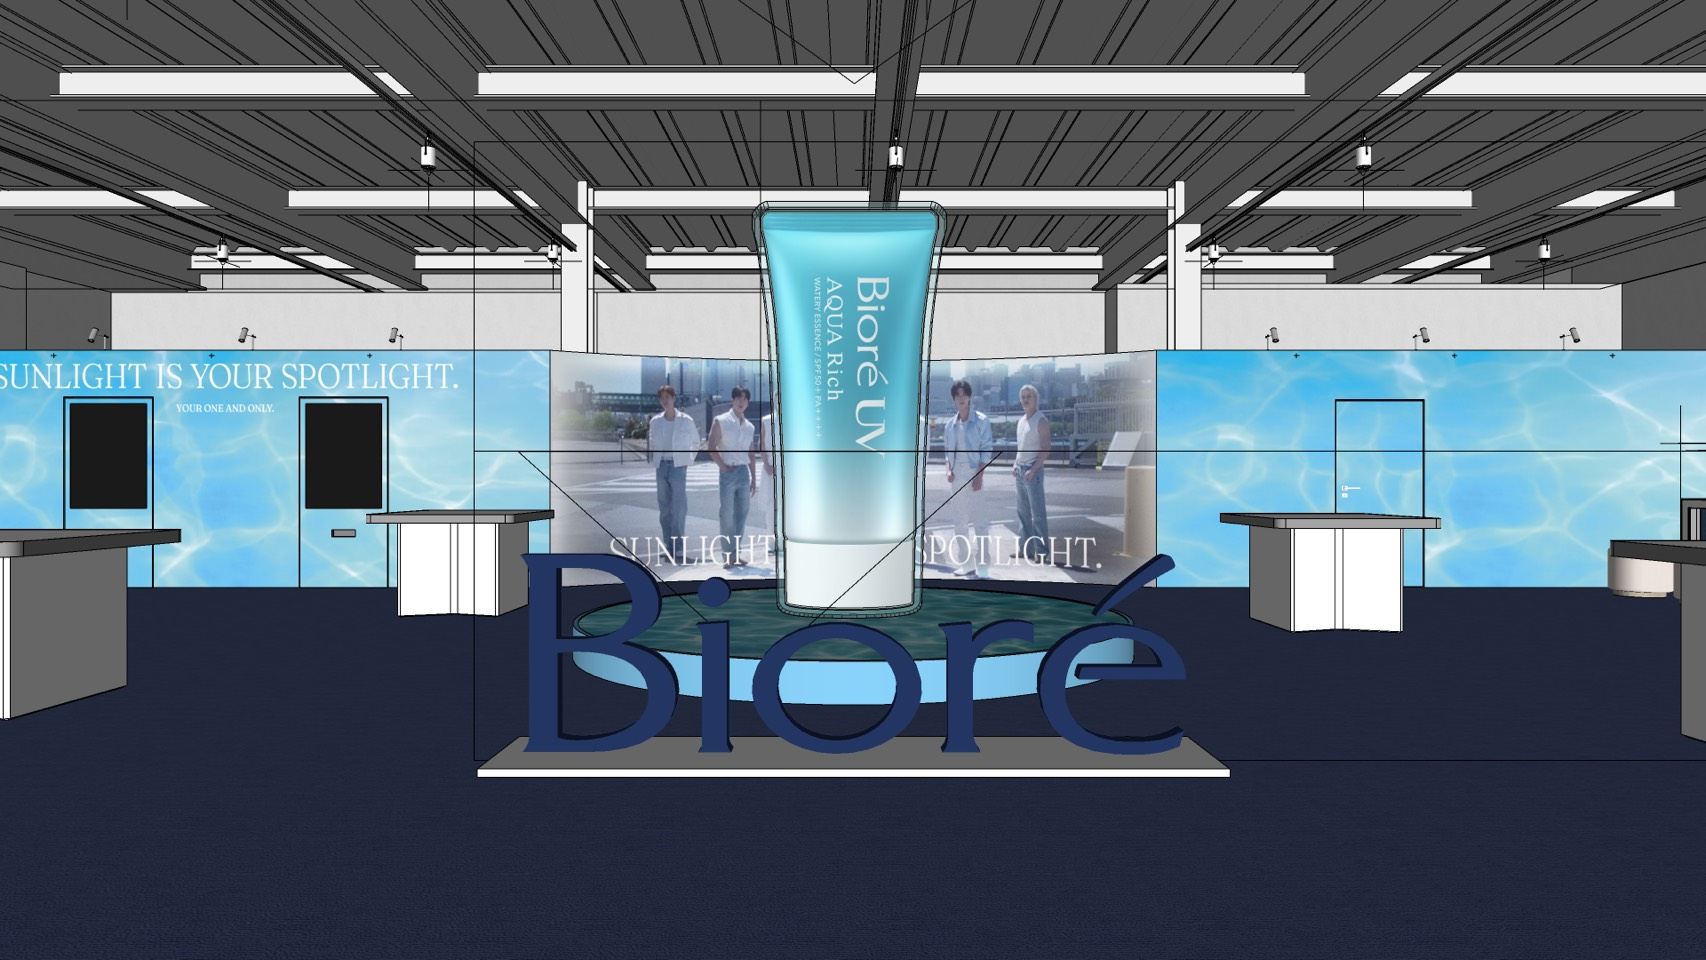
Stray Kids x Bioré UV: Anthem Film Featuring New Song “Endless Sun” Launches Globally on March 19 (JST)
Bioré UV, Kao Corporation’s sunscreen brand, will launch its global campaign “SUNLIGHT IS YOUR SPOTLIGHT.” featuring Stray Kids in more than 15 countries and regions beginning 20:30 (JST), March 19, 2026.
The campaign features an anthem film set to the original song “Endless Sun,” written, composed, and produced by Stray Kids, alongside key visuals and a range of global initiatives. Limited-time POP-UP events will also open in Osaka (Japan) and Seongsu, Seoul (Korea), offering immersive collaboration content and product experiences.
Through this campaign, Bioré UV communicates its core value globally: combining high UV protection with a comfortable texture designed for everyday use.
This press release features multimedia. View the full release here: https://www.businesswire.com/news/home/20260319155970/en/

Special Website: https://www.kao.co.jp/bioreuv/sunlightisyourspotlight/en/
Background of the Global Campaign
Amid rising global temperatures and changing UV environment, more people have become cautious about spending time under the sun. In response, Bioré UV has redefined the sun—not as something to avoid, but as a spotlight that empowers individuals to shine.
Since 2025, Bioré UV has partnered with globally acclaimed K-pop group Stray Kids under the message “SUNLIGHT IS YOUR SPOTLIGHT.” Now in its second year, the campaign marks a milestone with the brand’s first-ever music collaboration.
“Endless Sun,” created exclusively for this campaign, is a fully original anthem written, composed, and produced by Stray Kids.
The anthem film embodies Bioré UV’s message of empowering everyone to step into the sunlight with confidence, supported by its powerful UV protection.
“Endless Sun” — An Anthem Song Co-Created with Stray Kids, Sharing the Brand’s Vision
Streaming URL:
Spotify https://bit.ly/40ZAv6P
Apple Music https://bit.ly/4brUq3h
YouTube Music https://bit.ly/4rzQ28l
Amazon Music https://bit.ly/4sGElgY
Comment from Stray Kids
“We are truly honored to have created this song in collaboration with Bioré UV. Having used Bioré UV in our daily activities, we have personally felt the reassurance and positivity that allow us to shine as ourselves even under the sun, and we incorporated those emotions into this track. We hope it encourages everyone to step confidently into the sunlight.”
About the Anthem Film — “SUNLIGHT IS YOUR SPOTLIGHT.”
Anthem Film (60-second version):
https://www.youtube.com/watch?v=7c2cCjcB1TQ
The anthem film portrays the members of Stray Kids engaging freely with sunlight in their own ways. It opens with Felix gazing at the sun and whispering, “I wanna kiss you back.” before the members move through a city illuminated by light. Through beams and reflections, each member walks confidently in their own direction, expressing the beauty of shining under the sun. The film culminates in a collective message encouraging all who step into the sunlight.
POP-UP Events in Japan and Korea: “Bioré UV × Stray Kids ‘STAY in Spotlight”
Limited-time POP-UP events will be held in Osaka and Seongsu, Seoul, where Bioré UV will make its full-scale Korean market entry in 2026. Visitors will not only be able to experience Bioré UV products but also explore campaign visuals, Stray Kids autographed life-sized standee, costumes worn during filming, product displays, and interactive activities including lucky draws.
Seoul (Seongsu), Korea
Period: March 20 (Fri) – March 29 (Sun), 2026
Venue: LECT Seongsu
Address: 65 Yeonmujang-gil, Seongdong-gu, Seoul, South Korea
Opening Hours: 12:00 PM – 8:00 PM (KST)
Admission: Advance reservation via Naver or same-day entry
Osaka (Shinsaibashi), Japan
Period: March 30 (Mon) – June 30 (Tue), 2026
Venue: Kao Wow
Address: 1F Taiko Building, 3-6-13 Minamikyuhojimachi, Chuo-ku, Osaka, Japan
Opening Hours: 11:00 AM – 6:00 PM (JST)
(Closed on Saturdays, Sundays, and national holidays)
Admission: Walk-in entry
Exhibition content and admission procedures are subject to change.
Global Campaigns to be Launched Sequentially in Each Region
We will sequentially roll out various campaigns in markets worldwide where Bioré UV is available. *Please note that the availability, timing, and specific details of these campaigns will vary by country and region.
Background on the Appointment of Stray Kids
Bioré UV is currently available in 39 countries and regions worldwide. Stray Kids, who have continued to challenge global stages since their trainee days, embody the message “SUNLIGHT IS YOUR SPOTLIGHT.” Through this collaboration, Bioré UV aims to deepen global engagement and become an irreplaceable presence in everyday life.
About Stray Kids
Stray Kids is a boy group under JYP Entertainment that debuted in 2018. The word “Stray” in the group name “Stray Kids” carries the meaning of breaking away from old traditions, formats, and systems.
The members are actively involved in writing, composing, and producing their own music, and in 2025 they became record holders for the best-selling K-pop album in the United States.
Since their album SKZ IT TAPE ‘DO IT’, released last November, debuted at No.1 on the U.S. Billboard 200, the group has achieved eight consecutive No.1 debuts on the chart. No artist had previously debuted eight albums in a row at No.1, making it a historic first worldwide. As a result, Stray Kids have been recognized as one of the top-charting groups on the Billboard 200 in the 2000s.
In addition, the group successfully completed their largest-scale world tour to date, Stray Kids World Tour [dominATE], last year. Their popularity has grown beyond Japan and Korea, becoming a global phenomenon across the United States and around the world.
About Bioré
Bioré is a global skincare brand of Kao Corporation, offering high-performance facial cleansing, pore care, body care, and UV protection products designed to fit seamlessly into everyday life. Leveraging proprietary technologies developed through Kao’s long-standing research expertise, Bioré offers solutions that combine effectiveness with a comfortable feel, tailored to diverse skin needs.
Available in 66 countries and regions across Asia, the Americas, and Europe, Bioré continues to grow its global presence and to be chosen by consumers worldwide.
Official Bioré UV Brand Website: https://www.kao.co.jp/bioreuv/
View source version on businesswire.com: https://www.businesswire.com/news/home/20260319155970/en/
Contact
Kao Bioré V PR Office (in KMC Co., Ltd.)
Ririka Takasu / Takahiro Otsuka / Eri Sato
Tel: +81-3-6261-7413
Email: info@kmcpr.co.jp
Media Assets: https://bit.ly/bioreuv_0319 [Password: kao0319]
Abstract
Kao Corporation’s Bioré UV will launch its global campaign “SUNLIGHT IS YOUR SPOTLIGHT.” featuring Stray Kids beginning 20:30 (JST), March 19, 2026.


Algoma Central Corporation Announces Renewal of Normal Course Issuer Bid
Algoma Central Corporation (“Algoma” or the “Company”) (TSX:ALC), a leading provider of marine transportation services, announced today that the Toronto Stock Exchange (“TSX”) has accepted its notice of intention to proceed with the renewal of its normal course issuer bid (the “NCIB”).
Algoma’s Board of Directors believes that the market price of Algoma’s common shares (“Shares”), from time to time, may not reflect the inherent value of the Company and purchases of Shares pursuant to the NCIB may represent an appropriate and desirable use of funds. Any purchases made under the NCIB will be made by Algoma subject to favourable market conditions at the prevailing market price at the time of acquisition through the facilities of the TSX and/or alternative Canadian trading systems.
Pursuant to the notice, during the twelve month period commencing March 23, 2026 and ending March 22, 2027, Algoma may purchase up to 2,028,391 of its Shares, representing approximately 5% of the 40,567,816 Shares that were issued and outstanding as of March 9, 2026. Under the NCIB, other than purchases made pursuant to block purchase exemptions, Algoma may purchase up to 2,057 Shares on the TSX during any trading day, which represents approximately 25% of the average daily trading volume of the Shares on the TSX for the past six calendar months, being 8,230 Shares. Any Shares purchased under the NCIB will be cancelled.
In conjunction the renewal of the NCIB, Algoma has entered into a new automatic share purchase plan (the “ASPP”) with a designated broker to allow for the purchase of its Shares under the NCIB at times when Algoma normally would not be active in the market due to applicable regulatory restrictions or internal trading black-out periods.
Before the commencement of any particular internal trading black-out period, Algoma may, but is not required to, instruct its designated broker to make purchases of Shares under the NCIB during the ensuing black-out period in accordance with the terms of the ASPP. Such purchases will be determined by the broker in its sole discretion based on parameters established by Algoma prior to commencement of the applicable black-out period in accordance with the terms of the ASPP and applicable TSX rules. Outside of these black-out periods, Shares will continue to be purchasable by Algoma at its discretion under its NCIB.
The ASPP will commence on the Company’s behalf during the quarterly blackout period of the Company for its first quarter 2026 results commencing March 31, 2026 and will terminate on the earliest of the date on which: (a) the maximum annual purchase limit under the NCIB has been reached; (b) Algoma terminates the ASPP in accordance with its terms; or (c) the NCIB expires. The ASPP constitutes an “automatic securities purchase plan” under applicable Canadian securities laws.
The Company’s previous NCIB commenced on March 21, 2025 and expires on March 20, 2026 (the “Previous NCIB”). Under the Previous NCIB, the Company obtained the approval of the TSX to purchase up to 2,028,391 Shares, which represented 5% of the 40,567,816 Shares issued and outstanding as at the close of business on March 7, 2025. As of March 9, 2026, the Company has not purchased any shares under the Previous NCIB and may continue to purchase shares up to the expiry date.
Although Algoma intends to purchase Shares under its NCIB there can be no assurances that any such purchases will be completed.
About Algoma Central Corporation
Algoma Central Corporation is a global provider of marine transportation, owning and operating dry and liquid bulk carriers that serve critical industries throughout the Great Lakes-St. Lawrence Region and internationally. Focused on delivering exceptional customer service, utilizing fuel efficient vessels, and advancing innovative technologies, Algoma drives productivity while contributing to economic growth, strengthening communities, and supporting its people. Algoma truly is Your Marine Carrier of Choice™. Learn more at algonet.com.
Forward-looking Statements
Algoma Central Corporation’s public communications often include written or oral forward-looking statements. Statements of this type are included in this document and may be included in other filings with Canadian securities regulators or in other communications. All such statements are made pursuant to the safe harbour provisions of any applicable Canadian securities legislation. Forward-looking statements may involve, but are not limited to, comments with respect to our objectives and priorities for 2025 and beyond, our strategies or future actions, our targets, expectations for our financial condition or share price and the results of or outlook for our operations or for the Canadian, U.S. and global economies. The words “may”, “will”, “would”, “should”, “could”, “expects”, “plans”, “intends”, “trends”, “indications”, “anticipates”, “believes”, “estimates”, “predicts”, “likely” or “potential” or the negative or other variations of these words or other comparable words or phrases, are intended to identify forward-looking statements.
By their nature, forward-looking statements require us to make assumptions and are subject to inherent risks and uncertainties. There is significant risk that predictions, forecasts, conclusions or projections will not prove to be accurate, that our assumptions may not be correct and that actual results may differ materially from such predictions, forecasts, conclusions or projections. We caution readers of this document not to place undue reliance on our forward-looking statements as a number of factors could cause actual future results, conditions, actions or events to differ materially from the targets, expectations, estimates or intentions expressed in the forward-looking statements.
View source version on businesswire.com: https://www.businesswire.com/news/home/20260319483052/en/
Contact
Gregg A. Ruhl
President and Chief Executive Officer
905-687-7890
Christopher Lazarz, CPA, CA
Chief Financial Officer
905-687-7940
Or visit
www.algonet.com or www.sedarplus.ca
Kolibri Global Energy Announces Year End Results With a 15% Increase in Production to Over 4,013 BOEPD
All amounts are in U.S. Dollars unless otherwise indicated:
2025 HIGHLIGHTS
- Average production for 2025 was 4,013 BOEPD, an increase of 15% compared to 2024 production of 3,478 BOEPD. The increase is due to production from the wells that were drilled and completed in 2025
- Net revenues for 2025 were $56.9 million, a decrease of 3% compared to 2024. This decrease was primarily due to a 16% decrease in average prices partially offset by a 15% increase in production in 2025 compared to 2024
- Adjusted EBITDA(1) was $42.1 million in 2025 compared to $44.0 million in 2024, a decrease of 4%. The decrease was primarily due to the decrease in revenue from lower prices.
- The Company’s Total Proved Reserves for 2025 increased by 1% to 40.8 million barrels of oil equivalent, from 2024 with an NPV10 of $440.7 million, according to the Company’s December 31, 2025, independent reserves evaluation
- Net income in 2025 was $15.5 million ($0.44 per basic share) compared to $18.1 million ($0.51 per basic share) in 2024. The decrease was due to lower revenue from lower average prices, higher depletion expense and higher operating expenses due to increased production
- Netback from operations(2) decreased to $31.49 per BOE compared to $38.54 per BOE in 2024, a decrease of 18% primarily due to lower average prices
- Production and operating expense per barrel averaged $7.33 per BOE in 2025 compared to $7.44 per BOE in 2024, a decrease of 1%
| (1) | Adjusted EBITDA is considered a non-GAAP measure. Refer to the section entitled “Non-GAAP Measures” of this earnings release. |
| (2) | Netback from operations is considered a non-GAAP ratio. Refer to the section entitled “Non-GAAP Measures” of this earnings release. |
Kolibri’s President and Chief Executive Officer, Wolf Regener commented:
“We are pleased with the continued production growth of the Company in 2025 to 4,013 BOEPD, which was within our guidance. Over the last three years, we have achieved a fantastic 35% compound annual production growth rate. During 2025, we generated $56.9 million of net revenue and $42.1 of Adjusted EBITDA(1) but they were below our guidance due to fourth quarter oil prices that were 10% below our forecast price as well as delays in new wells coming online due to the drill pipe failure on the Barnes well. The four wells that started production at the end of the year increased our December production to over 5,600 BOE per day. The production and cash flow impact of these wells will now be reflected primarily in our 2026 results. The significant increase in oil prices in March 2026 should further improve our 2026 results.
“We look forward to continuing our success with our 2026 drilling program which we are currently finalizing with an expected start date in June. We are preparing multiple pad locations to be able to quickly increase our planned drilling if oil prices remain elevated through 2026, but we expect our capital expenditures to be significantly lower than 2025 levels.”
| (1) | Adjusted EBITDA is considered a non-GAAP measure. Refer to the section entitled “Non-GAAP Measures” of this earnings release. |
Fourth Quarter |
|
Year Ended Dec 31, |
|||||||||
2025 |
|
2024 |
|
% |
|
2025 |
|
2024 |
|
% |
|
|
|||||||||||
Net Income: |
|||||||||||
$ Thousands |
$3,261 |
|
$5,643 |
|
(42%) |
|
$15,477 |
|
$18,115 |
|
(15%) |
$ per basic common share |
$0.09 |
|
$0.16 |
|
(44%) |
|
$0.44 |
|
$0.51 |
|
(14%) |
$ per diluted shares |
$0.09 |
|
$0.15 |
|
(40%) |
|
$0.43 |
|
$0.50 |
|
(14%) |
|
|
|
|
|
|
|
|
|
|
|
|
Adjusted EBITDA(1) |
$10,542 |
|
$13,493 |
|
(22%) |
|
$42,107 |
|
$44,039 |
|
(4%) |
Capital Expenditures |
$18,419 |
|
$9,706 |
|
90% |
|
$62,639 |
|
$31,251 |
|
100% |
|
|
|
|
|
|
|
|
|
|
|
|
Average Production (Boepd) |
4,493 |
|
4,440 |
|
1% |
|
4,013 |
|
3,478 |
|
15% |
Gross Revenue |
18,349 |
|
22,185 |
|
(17%) |
|
72,093 |
|
74,592 |
|
(3%) |
Net Revenue |
14,740 |
|
17,374 |
|
(15%) |
|
56,856 |
|
58,524 |
|
(3%) |
Average Price per Barrel |
$44.39 |
|
$54.32 |
|
(18%) |
|
$49.22 |
|
$58.60 |
|
(16%) |
Netback from operations per Barrel(2) |
$27.99 |
|
$35.94 |
|
(22%) |
|
$31.49 |
|
$38.54 |
|
(18%) |
Netback including commodity contracts per Barrel(2) |
$28.31 |
|
$35.90 |
|
(21%) |
|
$31.62 |
|
$38.05 |
|
(17%) |
|
|
|
|
|
|
|
|
|
|
|
|
|
|
December 2025 |
|
|
|
December 2024 |
|
|
|
|
|
Cash and Cash Equivalents |
|
|
$2,797 |
|
|
|
$4,314 |
|
|
|
|
Working Capital |
|
|
$(12,573) |
|
|
|
$(657) |
|
|
|
|
Borrowing Capacity |
|
|
15,542 |
|
|
|
16,542 |
|
|
|
|
(1) |
Adjusted EBITDA is considered a non-GAAP measure. Refer to the section entitled “Non-GAAP Measures” of this earnings release. |
(2) |
Netback from operations and netback including commodity contracts are considered non-GAAP ratios. Refer to the section entitled “Non-GAAP Measures” of this earnings release. |
YEAR ENDED 2025 TO YEAR ENDED 2024
For 2025, oil and gas gross revenues decreased $2.5 million or 3% to $72.1 million. Oil revenues before royalties decreased by 8% to $63.0 million due to a 15% decrease in prices partially offset by an 8% increase in production. Natural gas revenues before royalties increased by 126% to $3.9 million due to a 58% increase in the average gas price and a 44% increase in natural gas production. NGL revenue before royalties increased by 13% to $5.2 million due to a 27% increase in production partially offset by a 11% decrease in average prices.
Average production for 2025 was 4,013 BOEPD, an increase of 15% compared to 2024 average production of 3,478 BOEPD due to the wells drilled during the year.
Production and operating expenses increased by $1.1 million due to an increase in production for 2025. Production and operating expense per barrel averaged $7.33 per BOE in 2025 compared to $7.44 per BOE in 2024, a decrease of 1%. The 2025 amount includes reassessed production tax adjustments related to prior periods that were recorded in 2025, totaling $0.3 million, or $0.21 per BOE. The 2024 amount includes natural gas and NGL processing costs of $0.8 million, or $0.63 per BOE, related to prior years as the purchaser reassessed prior year gathering and processing costs in 2024. Excluding these adjustments, production and operating expenses per barrel were $7.12 per BOE in 2025 and $6.81 per BOE in 2024, an increase of 5%, due to a higher number of well reworks in 2025.
Depletion and depreciation expense increased $1.1 million, or 7%, in 2025 due to increased production and a higher PP&E balance.
G&A expenses increased $0.1 million or 1% in 2025 due to costs related to a special shareholder meeting that was held in November 2025. Excluding these costs, G&A expenses decreased by 3%.
Finance expense decreased by $0.6 million due a realized loss on commodity contracts of $0.6 million in 2024.
Capital expenditures were $62.6 million in 2025 compared to $31.3 million in 2024, an increase of 100% due a significant increase in drilling activity in 2025 compared to the prior year as the Company drilled four more wells and fracture stimulated two more wells than in 2024. Capital expenditures were over our forecasted guidance due to the redrill costs from the drill pipe failure and severe weather related issues.
FOURTH QUARTER HIGHLIGHTS:
- Average production for the fourth quarter of 2025 was 4,493 BOEPD, an increase of 1% compared to fourth quarter 2024 production of 4,440 BOEPD. The increase is due to production from the new wells drilled at the end of the year which came on production in December 2025
- Net revenues for the fourth quarter of 2025 were $14.7 million, a decrease of 15% compared to the fourth quarter of 2024. This decrease was primarily due to a 18% decrease in average prices
- Net income in the fourth quarter of 2025 was $3.3 million ($0.09 per basic share), compared to net income of $5.6 million ($0.16 per basic share) in the fourth quarter of 2024. The decrease was due to lower revenue from decreased average prices and higher operating expenses from higher production
- Adjusted EBITDA(1) was $10.5 million in the fourth quarter of 2025 compared to $13.5 million in 2024, a decrease of 22%. This decrease was due to a decrease in average prices partially offset by an increase in production
- Netback from operations(2) decreased to $27.99 per BOE in the fourth quarter of 2025 compared to $35.94 per BOE in the fourth quarter of 2024, a decrease of 22%. Netback including commodity contracts(2) for the fourth quarter of 2025 was $28.31 per BOE compared to $35.90 in the fourth quarter of 2024, a decrease of 21% from the prior year quarter. The 2025 decreases compared to the prior year were due to the 18% decrease in average prices
- Production and operating expense per barrel averaged $7.67 per BOE in the fourth quarter of 2025 compared to $6.59 per BOE in the fourth quarter of 2024, an increase of 16% due to reworking a well.
(1) |
Adjusted EBITDA is considered a non-GAAP measure. Refer to the section entitled “Non-GAAP Measures” of this earnings release. |
(2) |
Netback from operations and netback including commodity contracts are considered non-GAAP ratios. Refer to the section entitled “Non-GAAP Measures” of this earnings release. |
FOURTH QUARTER 2025 TO FOURTH QUARTER 2024
Gross oil and gas revenues totaled $18.3 million in the fourth quarter of 2025 versus $22.2 million in the fourth quarter of 2024, a decrease of 17%. Oil revenues before royalties were $16.4 million in the fourth quarter of 2025 versus $19.7 million in the fourth quarter of 2024, a decrease of 16%, due to lower prices. Natural gas revenues before royalties decreased 9% to $0.8 million in the fourth quarter of 2025 due to lower average prices. NGL revenue before royalties decreased 34% to $1.0 million due to lower average prices.
Operating expenses were $2.8 million in the fourth quarter of 2025 compared to $2.4 million in 2024 due to higher production and reworking a well.
G&A expenses increased by 3% in the fourth quarter of 2025 compared to the prior year fourth quarter due to costs related to a special shareholder meeting that was held in November 2025.
Finance expense in the fourth quarter of 2025 decreased by $0.3 million from the fourth quarter of 2024 due to an unrealized loss on commodity contracts in the fourth quarter of 2024.
KOLIBRI GLOBAL ENERGY INC. CONDENSED CONSOLIDATED STATEMENTS OF FINANCIAL POSITION (Unaudited, Expressed in Thousands of United States Dollars) |
||||||||
|
|
|
|
|||||
|
|
December 31, |
|
December 31, |
||||
|
|
|
2025 |
|
|
|
2024 |
|
Current assets |
|
|
|
|||||
Cash and cash equivalents |
|
$ |
2,797 |
|
$ |
4,314 |
|
|
Accounts receivable and other receivables |
|
|
8,070 |
|
|
9,733 |
|
|
Deposits and prepaid expenses |
|
|
769 |
|
|
718 |
|
|
Fair value of commodity contracts |
|
|
393 |
|
|
254 |
|
|
|
|
|
12,029 |
|
|
15,019 |
|
|
|
|
|
|
|||||
Non-current assets |
|
|
|
|||||
Property, plant and equipment |
|
|
280,172 |
|
|
232,962 |
|
|
Right of use assets |
|
|
1,741 |
|
|
748 |
|
|
Fair value of commodity contracts |
|
|
– |
|
|
30 |
|
|
|
|
|
|
|||||
Total assets |
|
$ |
293,942 |
|
$ |
248,759 |
|
|
|
|
|
|
|||||
Current liabilities |
|
|
|
|||||
Accounts payable and other payables |
|
$ |
23,183 |
|
$ |
15,090 |
|
|
Lease liabilities |
|
|
1,419 |
|
|
586 |
|
|
|
|
|
24,602 |
|
|
15,676 |
|
|
|
|
|
|
|||||
Non-current liabilities |
|
|
|
|||||
Loans and borrowings |
|
|
48,757 |
|
|
33,240 |
|
|
Asset retirement obligations |
|
|
2,259 |
|
|
2,168 |
|
|
Deferred taxes |
|
|
14,083 |
|
|
8,701 |
|
|
Lease liabilities |
|
|
365 |
|
|
167 |
|
|
|
|
|
65,464 |
|
|
44,276 |
|
|
|
|
|
|
|||||
Equity |
|
|
|
|||||
Shareholders’ capital |
|
|
294,300 |
|
|
295,309 |
|
|
Treasury stock |
|
|
(202 |
) |
|
– |
|
|
Contributed surplus |
|
|
26,183 |
|
|
25,380 |
|
|
Deficit |
|
|
(116,405 |
) |
|
(131,882 |
) |
|
Total equity |
|
|
203,876 |
|
|
188,807 |
|
|
|
|
|
|
|||||
Total equity and liabilities |
|
$ |
293,942 |
|
$ |
248,759 |
|
|
KOLIBRI GLOBAL ENERGY INC. CONDENSED CONSOLIDATED STATEMENTS OF OPERATIONS AND COMPREHENSIVE INCOME |
|||||||||||||||
(Unaudited, expressed in Thousands of United States dollars, except per share amounts) |
|||||||||||||||
|
Fourth Quarter December 31 |
|
Years ended December 31 |
||||||||||||
|
|
2025 |
|
|
|
2024 |
|
|
|
2025 |
|
|
|
2024 |
|
Revenue: |
|
|
|
|
|||||||||||
Oil and natural gas revenue, net |
$ |
14,740 |
|
$ |
17,374 |
|
$ |
56,856 |
|
$ |
58,524 |
|
|||
Other income |
|
1 |
|
|
67 |
|
|
565 |
|
|
127 |
|
|||
|
|
14,741 |
|
|
17,441 |
|
|
57,421 |
|
|
58,651 |
|
|||
Expenses: |
|
|
|
|
|||||||||||
Production and operating |
|
2,778 |
|
|
2,354 |
|
|
9,243 |
|
|
8,233 |
|
|||
Depletion, depreciation and amortization |
|
4,904 |
|
|
4,687 |
|
|
17,038 |
|
|
15,892 |
|
|||
General and administrative |
|
1,551 |
|
|
1,510 |
|
|
5,695 |
|
|
5,636 |
|
|||
Stock based compensation |
|
507 |
|
|
268 |
|
|
1,744 |
|
|
1,075 |
|
|||
|
|
9,740 |
|
|
8,819 |
|
|
33,720 |
|
|
30,836 |
|
|||
|
|
|
|
|
|||||||||||
|
|
|
|
|
|||||||||||
Finance income |
|
136 |
|
|
2 |
|
|
220 |
|
|
338 |
|
|||
Finance expense |
|
(1,153 |
) |
|
(1,405 |
) |
|
(3,576 |
) |
|
(4,174 |
) |
|||
Income tax expense |
|
(723 |
) |
|
(1,576 |
) |
|
(4,868 |
) |
|
(5,864 |
) |
|||
|
|
|
|
|
|||||||||||
Net income and comprehensive income |
$ |
3,261 |
|
$ |
5,643 |
|
$ |
15,477 |
|
$ |
18,115 |
|
|||
|
|
|
|
|
|||||||||||
Net income per share |
|
|
|
|
|||||||||||
Basic |
$ |
0.09 |
|
$ |
0.16 |
|
$ |
0.44 |
|
$ |
0.51 |
|
|||
KOLIBRI GLOBAL ENERGY INC. |
||||||||||||||
FOURTH QUARTER AND YEAR ENDED 2025 |
||||||||||||||
(Unaudited, expressed in Thousands of United States dollars, except as noted) |
||||||||||||||
|
||||||||||||||
|
||||||||||||||
Fourth Quarter |
|
Year Ended Dec. 31 |
||||||||||||
|
|
|
2025 |
|
|
2024 |
|
|
|
2025 |
|
|
2024 |
|
Oil revenue before royalties |
$ |
16,448 |
$ |
19,658 |
|
|
$ |
62,994 |
$ |
68,303 |
|
|||
Gas revenue before royalties |
|
|
856 |
|
937 |
|
|
|
3,945 |
|
1,745 |
|
||
NGL revenue before royalties |
|
|
1,045 |
|
1,592 |
|
|
|
5,154 |
|
4,544 |
|
||
|
|
|
18,349 |
|
22,187 |
|
|
|
72,093 |
|
74,592 |
|
||
|
|
|
|
|
|
|
||||||||
Adjusted EBITDA(1) |
|
10,542 |
|
13,493 |
|
|
42,107 |
|
44,039 |
|
||||
Capital expenditures |
|
18,419 |
|
9,706 |
|
|
62,639 |
|
31,251 |
|
||||
|
|
|
|
|
|
|
||||||||
Statistics: |
|
Fourth Quarter |
|
Year Ended Dec. 31 |
||||||||||
|
|
|
2025 |
|
|
2024 |
|
|
|
2025 |
|
|
2024 |
|
Average oil production (Bopd) |
|
3,131 |
|
3,097 |
|
|
2,726 |
|
2,520 |
|
||||
Average natural gas production (mcf/d) |
|
3,639 |
|
3,615 |
|
|
3,546 |
|
2,464 |
|
||||
Average NGL production (Boepd) |
|
755 |
|
740 |
|
|
696 |
|
547 |
|
||||
Average production (Boepd) |
|
|
4,493 |
|
4,440 |
|
|
|
4,013 |
|
3,478 |
|
||
Average oil price ($/bbl) |
$ |
57.11 |
$ |
69.00 |
|
$ |
63.32 |
$ |
74.06 |
|
||||
Average natural gas price ($/mcf) |
$ |
2.56 |
$ |
2.82 |
|
$ |
3.05 |
$ |
1.93 |
|
||||
Average NGL price ($/bbl) |
|
$ |
15.05 |
|
23.38 |
|
|
$ |
20.29 |
$ |
22.70 |
|
||
|
|
|
|
|
|
|||||||||
Average price per barrel |
|
$ |
44.39 |
$ |
54.32 |
|
|
$ |
49.22 |
$ |
58.60 |
|
||
Royalties per barrel |
|
|
8.73 |
|
11.79 |
|
|
|
10.40 |
|
12.62 |
|
||
Operating expenses per barrel |
|
|
7.67 |
|
6.59 |
|
|
|
7.33 |
|
7.44 |
|
||
Netback from operations(2) |
|
$ |
27.99 |
$ |
35.94 |
|
|
$ |
31.49 |
$ |
38.54 |
|
||
Price adjustment from commodity contracts (Boe) |
|
|
0.32 |
|
(0.04 |
) |
|
|
0.13 |
|
(0.49 |
) |
||
Netback including commodity contracts (Boe)(2) |
|
$ |
28.31 |
$ |
35.90 |
|
|
$ |
31.62 |
$ |
38.05 |
|
||
| (1) | Adjusted EBITDA is considered a non-GAAP measure. Refer to the section entitled “Non-GAAP Measures” of this earnings release. |
| (2) | Netback from operations and netback including commodity contracts are considered non-GAAP ratios. Refer to the section entitled “Non-GAAP Measures” of this earnings release. |
The information outlined above is extracted from and should be read in conjunction with the Company’s audited financial statements for the year ended December 31, 2025 and the related management’s discussion and analysis thereof, copies of which are available under the Company’s profile on SEDAR+ at www.sedarplus.ca.
NON-GAAP MEASURES
Netback from operations, netback including commodity contracts and adjusted EBITDA (collectively, the “Company’s Non-GAAP Measures”) are not measures or ratios recognized under Canadian generally accepted accounting principles (“GAAP”) and do not have any standardized meanings prescribed by IFRS. Management of the Company believes that such measures and ratios are relevant for evaluating returns on each of the Company’s projects as well as the performance of the enterprise as a whole. The Company’s Non-GAAP Measures may differ from similar computations as reported by other similar organizations and, accordingly, may not be comparable to similar non-GAAP measures and ratios as reported by such organizations. The Company’s Non-GAAP Measures should not be construed as alternatives to net income, cash flows related to operating activities, working capital or other financial measures and ratios determined in accordance with IFRS, as an indicator of the Company’s performance.
An explanation of how the Company’s Non-GAAP Measures provide useful information to an investor and the purposes for which the Company’s management uses the Non-GAAP Measures is set out in the management’s discussion and analysis under the heading “Non-GAAP Measures” which is available under the Company’s profile on SEDAR+ at www.sedarplus.ca and is incorporated by reference into this earnings release.
Netback from operations per barrel and its components are calculated by dividing revenue, less royalties and operating expenses by the Company’s sales volume during the period. Netback including commodity contracts is calculated by adjusting netback from operations by the realized gains or losses received from commodity contracts during the period. Netback is a non-GAAP ratio but it is commonly used by oil and gas companies to illustrate the unit contribution of each barrel produced. The Company believes that the netback is a useful supplemental measure of the cash flow generated on each barrel of oil equivalent that is produced in its operations. However, non-GAAP measures and non-GAAP ratios do not have any standardized meaning prescribed by IFRS and therefore, may not be comparable to similar measures or ratios used by other companies and should not be used to make comparisons.
The following is the reconciliation of the non-GAAP ratio netback from operations to net income, which the Company considers to be the most directly comparable financial measure that is disclosed in the Company’s financial statements:
| (US $000) | Year ended December 31, |
|||||||
|
2025 |
|
|
|
2024 |
|
||
Net income |
|
15,477 |
|
|
18,115 |
|
||
Adjustments: |
||||||||
Income tax expense |
|
|
4,868 |
|
|
5,864 |
|
|
Finance income |
|
(220 |
) |
|
(338 |
) |
||
Finance expense |
|
3,576 |
|
|
4,174 |
|
||
Stock based compensation |
|
1,744 |
|
|
1,075 |
|
||
General and administrative expenses |
|
5,695 |
|
|
5,636 |
|
||
Depletion, depreciation and amortization |
|
17,038 |
|
|
15,892 |
|
||
Other income |
|
(565 |
) |
|
(127 |
) |
||
Operating netback |
|
47,613 |
|
|
50,291 |
|
||
Netback from operations |
$ |
31.49 |
|
$ |
38.54 |
|
||
Adjusted EBITDA is calculated as net income before interest, taxes, depletion and depreciation and other non-cash and non-operating gains and losses. The Company considers this a key measure as it demonstrates its ability to generate cash from operations necessary for future growth excluding non-cash items, gains and losses that are not part of the normal operations of the Company and financing costs. The following is the reconciliation of the non-GAAP measure adjusted EBITDA:
(US $000) |
Year Ended
|
||||
2025 |
|
2024 |
|||
Net income |
15,477 |
|
18,115 |
|
|
Depletion and depreciation |
17,038 |
|
15,892 |
|
|
Accretion |
250 |
|
172 |
|
|
Interest expense |
3,291 |
|
3,382 |
|
|
Unrealized (gain) loss on commodity contracts |
32 |
|
(336 |
) |
|
Stock based compensation |
1,744 |
|
1,075 |
|
|
Interest income |
(31 |
) |
(2 |
) |
|
Income tax expense |
4,868 |
|
5,864 |
|
|
Other income |
(565 |
) |
(127 |
) |
|
Foreign currency loss |
3 |
|
4 |
|
|
Adjusted EBITDA |
42,107 |
|
44,039 |
|
|
PRODUCT TYPE DISCLOSURE
This news release includes references to sales volumes of “oil”, “natural gas”, and “barrels of oil equivalent” or “BOEs”. “Oil” refers to tight oil, and “natural gas” refers to shale gas, in each case as defined by NI 51-101. Production from our wells, primarily disclosed in this news release in BOEs, consists of mainly oil and associated wet gas. The wet gas is delivered via gathering system and then pipelines to processing plants where it is treated and sold as natural gas and NGLs.
CAUTIONARY STATEMENTS
In this news release and the Company’s other public disclosure:
| (a) | The Company’s natural gas production is reported in thousands of cubic feet (“Mcfs“). The Company also uses references to barrels (“Bbls“) and barrels of oil equivalent (“Boes“) to reflect natural gas liquids and oil production and sales. Boes may be misleading, particularly if used in isolation. A Boe conversion ratio of 6 Mcf:1 Bbl is based on an energy equivalency conversion method primarily applicable at the burner tip and does not represent a value equivalency at the wellhead. Given that the value ratio based on the current price of crude oil as compared to natural gas is significantly different from the energy equivalency of 6:1, utilizing a conversion on a 6:1 basis may be misleading as an indication of value. |
| (b) | Discounted and undiscounted net present value of future net revenues attributable to reserves do not represent fair market value. |
| (c) | Possible reserves are those additional reserves that are less certain to be recovered than probable reserves. There is a 10% probability that the quantities actually recovered will equal or exceed the sum of proved plus probable plus possible reserves. |
| (d) | The Company discloses peak and 30-day initial production rates and other short-term production rates. Readers are cautioned that such production rates are preliminary in nature and are not necessarily indicative of long-term performance or of ultimate recovery. |
Readers are referred to the full description of the results of the Company’s December 31, 2025 independent reserves evaluation and other oil and gas information contained in its Form 51-101F1 Statement of Reserves Data and Other Oil and Gas Information for the year ended December 31, 2025, which the Company filed on SEDAR on March 17, 2026.
Caution Regarding Forward-Looking Information
This release contains forward-looking information including estimates of reserves, the proposed timing and expected results of exploratory and development work including fracture stimulation and production from the Company’s Tishomingo field, Oklahoma acreage, the future performance of wells including following shut-in’s and restart of well(s), forecasts regarding the Company’s 2026 drilling program including expected annual average production, revenues and adjusted EBITDA, availability of funds from the Company’s reserves based loan facility, and the Company’s strategy and objectives. The use of any of the words “target”, “plans”, “anticipate”, “continue”, “estimate”, “expect”, “may”, “will”, “project”, “should”, “believe”, “intend” and similar expressions are intended to identify forward-looking statements.
Such forward-looking information is based on management’s expectations and assumptions, including that the Company’s geologic and reservoir models and analysis will be validated, that indications of early results are reasonably accurate predictors of the prospectiveness of the shale intervals, that previous exploration results are indicative of future results and success, that expected production from future wells can be achieved as modeled, declines will match the modeling, future well production rates will be improved over existing wells, that rates of return as modeled can be achieved, that recoveries are consistent with management’s expectations, including that new production will perform per a type curve which is similar to NSAI’s December 2025 proved type curve, that additional wells are actually drilled and completed, that design and performance improvements will reduce development time and expense and improve productivity, that discoveries will prove to be economic, that anticipated results and estimated costs will be consistent with management’s expectations, that all required permits and approvals and the necessary labor and equipment will be obtained, provided or available, as applicable, on terms that are acceptable to the Company, when required, that no unforeseen delays, unexpected geological or other effects, equipment failures, permitting delays or labor or contract disputes are encountered, that the development plans of the Company and its co-venturers will not change, that the demand for oil and gas will be sustained, that the price of oil will be sustained or increase, that the Company will continue to be able to access sufficient capital through financings, credit facilities, farm-ins or other participation arrangements to maintain its projects, that the Company will continue in compliance with the covenants under its reserves-based loan facility, that the Company will not be adversely affected by changing government policies and regulations, including tariffs or the threat of tariffs, social instability or other political, economic or diplomatic developments in the countries in which it operates and that global economic conditions will not deteriorate in a manner that has an adverse impact on the Company’s business and its ability to advance its business strategy.
Forward looking information involves significant known and unknown risks and uncertainties, which could cause actual results to differ materially from those anticipated. These risks include, but are not limited to: any of the assumptions on which such forward looking information is based vary or prove to be invalid, including that the Company’s geologic and reservoir models or analysis are not validated, anticipated results and estimated costs will not be consistent with managements’ expectations, the risks associated with the oil and gas industry (e.g. operational risks in development, exploration and production; delays or changes in plans with respect to exploration and development projects or capital expenditures; the uncertainty of reserve and resource estimates and projections relating to production, costs and expenses, and health, safety and environmental risks including flooding and extended interruptions due to inclement or hazardous weather), the risk of commodity price and foreign exchange rate fluctuations, risks and uncertainties associated with securing the necessary regulatory approvals and financing to proceed with continued development of the Tishomingo Field, the Company or its subsidiaries is not able for any reason to obtain and provide the information necessary to secure required approvals or that required regulatory approvals are otherwise not available when required, that unexpected geological results are encountered, that completion techniques require further optimization, that production rates do not match the Company’s assumptions, that very low or no production rates are achieved, that the price of oil will decline, that the Company will cease to be in compliance with the covenants under its reserves-based loan facility and be required to repay outstanding amounts or that the borrowing base will be reduced pursuant to a borrowing base re-determination and the Company will be required to repay the resulting shortfall, that the Company is unable to access required capital, that funding is not available from the Company’s reserves based loan facility at the times or in the amounts required for planned operations, that occurrences such as those that are assumed will not occur, do in fact occur, and those conditions that are assumed will continue or improve, do not continue or improve and the other risks identified in the Company’s most recent Annual Information Form under the “Risk Factors” section, the Company’s most recent management’s discussion and analysis and the Company’s other public disclosure, available under the Company’s profile on SEDAR+ at www.sedarplus.ca.
With respect to estimated reserves, the evaluation of the Company’s reserves is based on a limited number of wells with limited production history and includes a number of assumptions relating to factors such as availability of capital to fund required infrastructure, commodity prices, production performance of the wells drilled, successful drilling of infill wells, the assumed effects of regulation by government agencies and future capital and operating costs. All of these estimates will vary from actual results. Estimates of the recoverable oil and natural gas reserves attributable to any particular group of properties, classifications of such reserves based on risk of recovery and estimates of future net revenues expected therefrom, may vary. The Company’s actual production, revenues, taxes, development and operating expenditures with respect to its reserves will vary from such estimates, and such variances could be material. In addition to the foregoing, other significant factors or uncertainties that may affect either the Company’s reserves or the future net revenue associated with such reserves include material changes to existing taxation or royalty rates and/or regulations, and changes to environmental laws and regulations.
Although the Company has attempted to take into account important factors that could cause actual costs or results to differ materially, there may be other factors that cause actual results not to be as anticipated, estimated or intended. There can be no assurance that such statements will prove to be accurate as actual results and future events could differ materially from those anticipated in such statements. The forward-looking information included in this release is expressly qualified in its entirety by this cautionary statement. Accordingly, readers should not place undue reliance on forward-looking information. The Company undertakes no obligation to update these forward-looking statements, other than as required by applicable law.
About Kolibri Global Energy Inc.
Kolibri Global Energy Inc. is a North American energy company focused on finding and exploiting energy projects in oil and gas. Through various subsidiaries, the Company owns and operates energy properties in the United States. The Company continues to utilize its technical and operational expertise to identify and acquire additional projects in oil and gas. The Company’s shares are traded on the Toronto Stock Exchange under the stock symbol KEI and on the NASDAQ under the stock symbol KGEI.
View source version on businesswire.com: https://www.businesswire.com/news/home/20260318048859/en/
Contact
For further information, contact:
Wolf E. Regener, President and Chief Executive Officer +1 (805) 484-3613
Email: investorrelations@kolibrienergy.com
Website: www.kolibrienergy.com
TITAN Group: Full Year Results 2025
Regulatory News:
Titan SA (Euronext Brussels, Euronext Paris and ATHEX, “TITC”) announces the fourth quarter and full year 2025 financial results.
2025 Highlights
- Fifth consecutive year of sales growth, at €2.67bn, up +6.4% (LfL1), adjusted for (€136m) FX and scope change (sale of Adoçim), with improved volumes in the core materials and firm pricing. Sales (LfL1) grew across all regions: US, Greece, Southeast Europe and Eastern Mediterranean.
- Record EBITDA of €606m, up 9.3% (LfL1), adjusted for (€26m) FX and scope change (sale of Adoçim), with a 60bps margin expansion, driven by continued operational efficiencies, improved logistics, and lower solid fuel costs supported by record use of alternative fuels.
- Net profit after tax reached €236m and EPS at €3.2, representing a 7.4% growth YoY (LfL2), mainly due to adjustments for the one-off scope change (€51.9m, sale of Adoçim) and the non controlling interest of Titan America (€21.6m); ROACE stood at record 18.2%.
- Strong liquidity position, with year-end net debt at €214m and leverage ratio at 0.4x, notwithstanding the €224m 2025 dividend payment. Titan’s long-term issuer credit rating was upgraded, by both S&P and Fitch Credit Agencies, to “BB+ with positive outlook”.
- In 2025, Titan completed the IPO of Titan America on the NYSE, sold its stake in Adoçim (East Türkiye) and signed agreements to acquire Keystone Cement (Pennsylvania, USA), Traçim Cement (Greater Istanbul, Türkiye) and Vracs de l’ Estuaire (Le Havre, France), with the last two finalized early 2026.
- In 2025, the Group completed more bolt ons in aggregates in Greece, entered precast concrete via a JV in Western Balkans, secured approval for precast lintel production in Florida, and launched a strategic partnership in advanced mortars and insulation systems business.
- CapEx closed at €285m, in continuation of the CapEx acceleration program that started in 2022 and targets growth initiatives and cost efficiencies.
- November 2025 Investor Day marked the delivery of Strategy 2026 one year early and the unveiling of the Group’s new strategic growth plan TITAN Forward 2029, alongside refreshed strategic priorities and new mid term financial targets.
- Technological and AI-driven investments continue driving efficiencies in cement production. The Group has installed Real-Time Optimizers (RTOs) in assets of all cement plants, advancing toward its goal of digitalizing 100% of cement manufacturing by 2026.
- The Group continued lowering its CO2 footprint and was recognised by the Financial Times as Europe’s Climate Leader, by TIME as one of the World’s Most Sustainable Companies and included on the 2025 CDP A List.
- Proposed dividend payment increased, in line with EBITDA growth, by 10% versus 2024, at €1.10 per share for 2025 (excluding the €2.00 special ad-hoc dividend component related to the IPO).
- New €10m share buyback program to commence at the end of March 2026, with a duration of 9 months.
- Cautiously optimistic outlook, for 2026, thanks to increased volumes and sustained pricing, along with inorganic growth from the transactions recently announced: Low-Single Digit sales growth & Mid-Single Digit EBITDA growth (LfL), expected.
In million Euro, unless otherwise
|
|
FY
|
FY
|
%
|
|
Q4
|
Q4
|
%
|
Sales – LfL1 |
|
2,669.0 |
2,507.7 |
+6.4% |
|
656.5 |
607.3 |
+8.1% |
Sales – Reported |
2,669.0 |
2,644.0 |
+0.9% |
656.5 |
659.5 |
-0.5% |
||
EBITDA – LfL1 |
|
606.1 |
554.3 |
+9.3% |
|
132.5 |
132.2 |
+0.2% |
EBITDA – Reported |
606.1 |
580.1 |
+4.5% |
132.5 |
143.1 |
-7.4% |
||
Net Profit after Taxes & Minorities -LfL2 |
|
309.8 |
288.5 |
+7.4% |
|
70.3 |
70.8 |
-0.7% |
Net Profit after Taxes & Minorities – Reported |
236.3 |
289.2 |
-18.3% |
65.5 |
64.6 |
+1.4% |
||
Earnings per Share (€/share) – LfL2 |
|
4.2 |
3.9 |
+7.4% |
|
|
|
|
Earnings per Share (€/share) – Reported |
3.2 |
3.9 |
-18.3% |
|
1 Like-for-Like (LfL): Constant exchange rates and scope
2 Like-for-Like (LfL): Constant exchange rates and scope, adjusted for the non controlling interest of Titan America, the impact of the sale of Adoçim, the goodwill impairment in Türkiye in 2024, and a recognized deferred tax asset in Brazil in 2024
Marcel Cobuz, Chair of the Group Executive Committee
“2025 marked a milestone year for TITAN, delivering strong performance and successfully achieving in advance our 2026 strategic targets, showcasing the Group’s consistent ability to execute its strategy and deliver top-tier growth and returns in a volatile market environment. In 2025, we also completed the public listing of Titan America through an IPO on the NYSE and executed various portfolio transactions with 3 cement acquisitions signed and several aggregates bolt ons and cementitious and precast partnerships completed. Building on this momentum, we recently launched our new ‘Titan Forward 2029’ strategy, aimed at shaping a customer centric, future-ready TITAN, focused on growth of core heavy materials cement and aggregates, expand Alternative Cementitious business and invest in new technologies and platforms, delivering top-of-class growth and returns and pioneering a more digital and decarbonized business model. These achievements reflect the strength of our organization, where deep expertise and a results-driven mindset fuel innovation and long-term value creation, I warmly thank all our teams and partners for the outstanding job.”
John Ioannou, Group CFO
“Last year was a year of accelerated progress for Titan, as we delivered further growth in sales and profitability, strengthened our financial position, and enhanced our strategic flexibility. Building on a solid foundation, we achieved improved credit ratings and successfully raised new bond financing, reaffirming market confidence in our resilient cash flow generation and disciplined strategy execution. We continued to generate strong returns for our shareholders while investing decisively in our future – advancing our new 2029 strategic plans through both organic growth initiatives and value-accretive M&A. Our focus remains on operational excellence, capital allocation discipline and sustainable growth, ensuring Titan is well positioned to create long-term value.”
TITAN Group – Review of the year 2025
The Group continued its growth trajectory in 2025, with both sales and EBITDA increasing. Group sales grew by 6.4% (LfL1), reaching €2,669 million, driven by strong momentum in Greece and Egypt, and improved performance in Southeast Europe while US operations also contributed positively, excluding the effects from the weaker US dollar for much of the year. The year was marked by heightened geopolitical uncertainty, including tariff pressures on cement in the U.S. and another year of a sluggish residential market, partially offset by robust infrastructure demand in the U.S., strong momentum in Greece and a turnaround in Egypt. Our operations in Southeast Europe also closed the year positively, consolidating performance after a more challenging first half, against a record first half of 2024. Group EBITDA profitability improved year-over-year, surpassing the €600 million threshold, to reach €606.1 million, a 9.3% (LfL1) increase, adjusted for the lost contribution from Türkiye following the sale of Adoçim in May as well as the FX impact. This performance was driven by a resilient pricing environment across our global operations, including selective price increases in certain markets to counter inflationary pressures on electricity, raw materials and labor costs, alongside cement volume growth in Greece and Egypt, and higher export activity from Egypt. Significant growth has been recorded in downstream products, both in aggregates and ready-mix concrete. Ongoing investments in the digitalization of our end-to-end production and distribution processes, together with improvements in fuel substitution rates through increased use of alternative fuels, generated operational efficiencies that helped reduce total energy costs at Group level, effectively offsetting the rise in input costs. Group Net Profit After Taxes and Minority Interests attributable to shareholders reached €236.3 million for the year, growing by 7.4% year-on-year (LfL2), impacted by FX, scope change, the one-off €51.9 million impact from the divestment of the Group’s stake in Adoçim, the €21.6 million minority income in Titan America, following its IPO on February 2025, and a €5.9 million recognized deferred tax asset in Brazil in 4Q24. Earnings per share, reached €3.2/share, increased by +7.4% year-on-year (LfL2). The Group also continues to report very strong returns on capital, with a return on (average) capital employed (ROACE) of 18.2 % for 2025.
During a seasonally softer quarter for the industry, Group volumes in Q4 increased across all core products and in every region, supported by a particularly strong December. Sales in Q4 reached €656.5 million, up 8.1% (LfL1) versus 2024. Profitability was also slightly improved, with Q4 EBITDA growing by 0.2% (LfL1), reaching €132.5 million, adjusted for the divestment of Adoçim and the FX headwinds. Solid operational performance and healthy underlying demand trends towards these figures, with Egypt recording significant growth. Group Net Profit After Taxes and Minority Interests (LfL2) attributable to shareholders reached €70.3 million for the last quarter of the year.
In 2025, significant volume growth was achieved at Group level -continuing the positive trend of previous years- across our main product categories, both upstream and downstream. This performance was driven by solid demand, despite a slight drag on cement volumes in the first half of the year due to cold and rainy weather and the residential slowdown in the US. The Group’s cement sales ultimately closed the year at 18.0 million tonnes, representing a 1% increase year-over-year, LfL. This growth was underpinned by high single-digit growth in Greece, a strong second half in the US -given a softer comparable base in 2024 due to the hurricanes’ impact- , and a solid rebound in Egypt, while the Southeast Europe region ended the year at levels comparable to 2024. All Group exports from Greece were directed to TITAN’s own terminals -primarily to Titan America in the US- although volumes were lower year-over-year. Exports to our European terminals in France, the UK, and Italy also trailed last year’s performance. In contrast, Egypt recorded strong growth in cement exports. Ready-mix volumes increased by 6%, supported by the construction momentum in Greece and resilient demand in the US, reaching 6.4 million m³ at Group level by year-end, LfL. Aggregates volumes also grew by 9% to 23.7 million tonnes, driven by strong demand in Greece and increased demand in the US (Florida), supported by capital investments made in 2024. The Group’s building blocks volumes softened due to weaker residential demand in the US but showed a rebound in the fourth quarter. Volumes of cementitious materials, including fly ash and pozzolan, increased, alongside higher mortar volumes in Greece.
In million |
FY
|
FY
|
% yoy |
Cement (tonnes) – LfL |
18.0 |
17.8 |
+1% |
Cement (tonnes) – Reported |
|
18.4 |
-2% |
Ready-mix concrete (m3) – LfL |
6.4 |
6.1 |
+6% |
Ready-mix concrete (m3) – Reported |
|
6.3 |
+3% |
Aggregates (tonnes) |
23.7 |
21.8 |
+9% |
Cement sales in domestic markets and 3rd party exports, including clinker sales
Includes Brazil, does not include Associates
Financing & Investments
In 2025, the Group delivered strong Operating Free Cash Flow (OFCF) of €504 million, compared to €414 million in the prior year. This performance was supported by robust EBITDA growth, lower cash interest and tax payments, and disciplined operating cycle management, which resulted in a year-over-year reduction in working capital across most regions. In addition to recurring cash generation, the Group realized significant one-off inflows from milestone transactions, including the listing of a minority stake in Titan America on the NYSE in February 2025, raising $393 million in gross proceeds, and the divestment of Adoçim in Eastern Türkiye in May 2025. These actions enhanced financial flexibility and enabled the disciplined execution of the Group’s capital allocation priorities.
CapEx reached a record €285 million in 2025 (2024: €251 million), largely directed toward growth initiatives, including aggregates reserve expansion, stronger vertical integration, development of alternative cementitious materials (ACMs) platforms, and upgrades to digital, logistics and storage infrastructure. At the same time, capital resources were allocated to AI-powered logistics solutions aimed at improving operational efficiency and enhancing customer experience. Furthermore, IFESTOS, the Group’s carbon capture and storage (CCS) project, continued to progress through the development stage.
Targeted bolt-on acquisitions further expanded the Group’s aggregates footprint. In Greece, two quarries were acquired in Thessaly and Crete, the latter located near the new International Airport of Heraklion, currently under development. Together with similar investments completed in recent years, these additions secure aggregate reserves exceeding 200 million tonnes in the country. Vertical integration was further reinforced through ready-mix concrete investments, including a second unit at “The Ellinikon” development in Athens, a project-specific unit serving a gold mine in Northern Greece, and a newly inaugurated concrete plant in Southern Greece. Additionally, at the end of the year, a strategic partnership was established for the creation of a joint dry mortar company in Greece, strengthening the Group’s downstream presence.
In line with the Group’s Strategic Directions 2026 and further reinforced under the TITAN Forward 2029 Strategy, the expansion of ACM platforms remained a key priority. Building on earlier partnerships in Greece and Türkiye to secure pozzolan reserves, the Group advanced its fly ash strategy through the establishment of a joint venture in India to secure access to fly ash and a joint venture in the UK for the beneficiation of ponded fly ash, leveraging proprietary technology from ST Equipment & Technology enabling the efficient extraction and processing of previously unused materials. In early 2026, TITAN signed a 10-year agreement with Electric Power of Serbia securing access to approximately 5 million tonnes of fresh fly ash. These investments enhance supply security, support decarbonization targets, and strengthen cost competitiveness. The Group also expanded into structural precast, a business adjacent to its core heavy materials activities. Through a partnership with Molins, TITAN acquired an 80% stake in Baupartner, a leading precast concrete and steel structure specialist in Bosnia and Herzegovina. In the United States, Titan America accelerated its expansion into the precast and prestressed lintel market in Florida, securing key Miami-Dade approvals for more than 40 SKUs. Engineering and site development are underway for its first state-of-the-art lintel manufacturing facility. These initiatives broaden the Group’s product offering and enhance value creation across the construction value chain.
At the end of the year, TITAN announced milestone acquisitions that further expanded its core cement platform and production capacity. In November 2025, the Group announced the acquisition of the Vraçs de l’ Estuaire cementitious business in France, including a grinding plant at the port of Le Havre, with the transaction completed in January 2026. In December 2025, TITAN signed an agreement to acquire Traçim Cement in the Greater Istanbul market of Türkiye, operating a modern integrated plant with annual capacity of 2.5 million tonnes, with the transaction completed in early 2026. In January 2026, the Group also signed an agreement to acquire Keystone Cement Company in Pennsylvania, which operates an integrated cement plant with annual clinker capacity of approximately 1 million short tonnes, subject to regulatory approval and customary closing conditions.
The Group’s liquidity position strengthened significantly within 2025, reaching a low net debt level in the first half of the year at €137 million following the receipt of proceeds from the IPO of Titan America and the divestment of Adoçim. Notwithstanding the special and much higher dividend payment compared with the 2024 distribution, including a dividend amount of €224 million, net debt at year end stood at €214 million. This reduction in net debt contributed to a further decrease in the leverage ratio to 0.4x (2024: 1.1x). In January 2026, the Group, through its subsidiary Titan Global Finance Plc, issued senior unsecured notes with an aggregate principal amount of €350 million, bearing a fixed coupon of 3.5% per annum and maturing in 2031.
Resolutions of the Board of Directors – Dividend payout
The Board of Directors will propose to the Annual General Assembly of Shareholders, scheduled for 7 May 2026, the distribution of a dividend of €1.10 per share. This represents an increase of 10% compared to last year’s dividend of €1.00 (excluding the 2025 one-off special dividend of €2.00, related to the IPO), consistent with the Group’s commitment to increase shareholder returns at a double-digit annual rate, in line with profitability growth as confirmed at TITAN Forward 2029 Investor Day.
Additionally, the Board of Directors at its meeting on March 18, 2026, decided the initiation of a new share buyback program for a total value of up to €10 million, which will commence after the termination of the current one, at the end of March 2026, and is expected to be completed by December 31, 2026.
Regional review of the year 2025
|
Sales |
|
EBITDA |
||||
In million Euro, unless otherwise stated |
|
|
%
|
|
|
2024 |
%
|
USA – LfL USA – Reported |
1,480.9 1,480.9 |
1,455.0 1,517.9 |
+1.8% -2.4% |
334.5 334.5 |
316.9 332.6 |
+5.6% +0.6% |
|
Greece & W. Europe – LfL Greece & W. Europe – Reported |
518.8 518.8 |
459.7 459.7 |
+12.9% +12.9% |
61.2 61.2 |
55.5 55.5 |
+10.3% +10.3% |
|
Southeastern Europe – LfL Southeastern Europe – Reported |
418.5 418.5 |
418.4 416.1 |
+0.0% +0.6% |
148.8 148.8 |
167.3 166.3 |
-11.0% -10.5% |
|
Eastern Mediterranean – LfL Eastern Mediterranean – Reported |
250.8 250.8 |
174.6 250.3 |
+43.6% +0.2% |
61.6 61.6 |
14.6 25.7 |
+321.2% +139.6% |
|
USA
In 2025, the Group’s North American operations delivered record level revenue, profitability and operating cash flow despite a market backdrop marked by softer demand and economic uncertainty. This performance underscored the ability of the local business to deliver organic growth and outperform across the cycle. The year was marked by higher sales volumes in aggregates and fly ash, while volumes of ready-mix remained at the high levels of 2024. Cement and block volumes declined slightly reflecting the downturn in residential construction. Cement pricing remained broadly stable, while prices for aggregates, ready mix and fly ash continued to improve. Our strategic investments in aggregates capacity, logistics, and efficiency coupled with our strong participation in public sector activity (linked to the IIJA), private non residential construction (linked to data centers, manufacturing and logistics) as well as resilient pricing and self-help cost initiatives enabled our record performance. The Florida segment delivered record strong results, with increased aggregates capabilities and strong participation in the infrastructure and private non residential construction sectors more than offsetting weaker residential demand. In the Mid Atlantic, improved ready mix pricing, growth in infrastructure and private non residential construction (including data center demand), and cost initiatives partially mitigated the headwinds from inclement weather, tariffs and softer demand headwinds in NJ and NY metro area.
Overall, construction in the US was mixed in 2025, with divergence across end markets. Elevated interest rates and affordability continued to weigh on residential construction, although renovation and remodeling segments showed resilience. Infrastructure and public works provided a stabilizing base supported by federal and state funding. Non residential activity showed strength in data centers, power, logistics and manufacturing while traditional commercial and office construction slowed. In this mixed demand environment, the Group’s North American operations capitalized on its proven strengths: its strategic positioning and capital allocation, its integrated and interconnected business model, its unwavering focus on serving its customers, and its disciplined cost management. This allowed the Group to leverage opportunities in pockets of market growth, especially in infrastructure and large project activity where our diverse product mix and prior investments continued to drive performance – reinforcing our position as a leader in the markets we serve. Sales for Titan’s North American operations increased by 2% (LfL1), reaching €1.48 billion, while EBITDA reached €334.5 million, an increase of 5.6% (LfL1).
Greece & W. Europe & Corporate
In 2025, Titan’s operations in Greece sustained their upward trajectory, delivering robust double-digit revenue growth underpinned by favorable market conditions and enhanced operational performance. Cement consumption in Greece increased by a high single digit, with Group cement sales performing at par with the market. Domestic demand remained strong across all product categories, with notable double-digit increases in ready-mix concrete, aggregates, and dry mortars—underscoring the Group’s strategic emphasis on vertical integration and its evolution into a comprehensive solutions provider through the expansion of its value-added offerings. Sustained pricing strength was maintained across all product lines, offsetting a persistently higher cost base. The Group is embedded in all major projects currently underway in the country, such as the Ellinikon urban development, the new Airport in Crete, the expansion of the Athens Airport, the Thessaloniki Flyover where it is sole supplier, the extension of the Athens metro and in flooding repair in Thessaly. Reinforcing its commitment to high-growth regions, in the course of the year, Titan commissioned a modern concrete facility in Kalamata, Peloponnese—an asset acquired in 2024 and subsequently upgraded—and deployed a mobile ready-mix unit to support infrastructure development at a copper-gold mining site in Northern Greece. In a further move to consolidate its regional footprint, the Group acquired an aggregates and ready-mix firm in Crete, facilitating participation in major projects on the island through ensuring logistical efficiency gains and streamlined project cost management. Bolt-on acquisitions in Crete and Thessaly augment Titan’s raw material reserves and reinforced its integrated market presence. Moreover, TITAN entered into a strategic alliance in the mortars and external thermal insulation segment, aimed at broadening its geographic reach and securing a leadership position in this rapidly expanding market. The domestic Greek market was the main driver of sales and profitability offsetting the performance of export sales to the US. Augmenting that strategy, was the group’s acquisition of one more terminal and grinding unit, Vracs de L’ Estuaire, operating a state-of-the-art grinding plant, strategically located at the port of Le Havre in Northern France, with annual clinker grinding capacity of 0.6 million tonnes, serving one of Europe’s largest and fastest-growing construction markets.
To meet the growing demand, the Group continued to invest throughout the year, increasing storage capacity for final product and increased Alternative Cementitious Materials (ACMs) usage, expanded its cement and ready-mix fleet, and invested in strengthening its supply chain in alternative fuels and their attendant feeding systems in both the Thessaloniki and Kamari plants. Notably, in 2025 the Kamari plant achieved record levels of ca. 60% in alternative fuels usage. Process automation work through the Group’s pioneering Real-Time Optimizers (RTOs) is being rolled out across the Group’s assets in Greece, together with upgrades to meet the increased volume intensity of work, such as the introduction of more mobile units to serve the increasing number of projects. Overall, sales for this region in 2025 increased by 12.9% (LfL1) to €518.8, while EBITDA reached €61.2 million, growing by 10.3%.
Southeastern Europe
In 2025, Titan’s operations in Southeastern Europe maintained stable revenues year-on-year, as broadly unchanged volumes and pricing offset competitive pressures, particularly from import activity. Residential construction remained the primary demand driver across most markets, while infrastructure investment played a more prominent role in cement consumption in Bulgaria and Serbia. Pricing trends varied across the region, with Bulgaria achieving the most pronounced increases, in contrast to softer pricing conditions in Albania. Cement consumption in Albania increased, as did our volumes, driven by demand in the residential sector. Increased pressure from imports, however, led to pricing pressure and impacted Titan cement volumes, which grew at a slower pace than the market. In Bulgaria, the domestic construction market expanded, driven mainly by infrastructure and commercial projects in major cities. TITAN’s sales grew year-on-year as a result of higher pricing and increased volumes. Notably, Group’s ready-mix operations, mainly in Sofia, recorded significant growth, supported by strong local demand. The Group’s decarbonization efforts continued in 2025, building on the 2024 inauguration of the solar plant, which supplies up to 13% of the plant’s electricity needs, while the alternative fuels substitution rate exceeded 50%. Domestic cement demand in Kosovo also increased, with the country continuing to benefit from EU-related remittances and growing foreign direct investment, however TITAN’s sales volumes did not increase due to heightened competitive pressures. Demand was driven predominantly by the residential sector. Thanks to changes in product mix, the clinker-to-cement ratio declined further and remained the lowest among the Group’s regional operations. In North Macedonia, the construction market expanded, driven by residential projects, while new infrastructure projects experienced delays. Titan’s cement volumes increased, supported by moderate pricing adjustments. During the year, the Group introduced two new mobile ready-mix units to support existing infrastructure projects and ensure the efficient continuation of its ready-mix operations. Cement consumption in Serbia declined slightly after reaching record levels in 2024. Infrastructure projects -mainly highways and projects related to EXPO 2027- continued to support construction activity. Notably, in January 2026, Titan signed a 10-year contract with Electric Power of Serbia (EPS), the country’s state-owned power utility, under which the Group secures access to ca. 5 million tonnes of fresh fly ash, reinforcing the Group’s long-term strategic resource in alternative cementitious materials. Overall, EBITDA for the region declined from the prior year’s record levels, impacted by higher input and labor costs, as well as temporary production disruptions. Despite these headwinds, the region continued to deliver the highest margins across the Group, underscoring its operational resilience in the region. Overall, sales slightly increased at €418.5 million, while EBITDA reached €148.8 million.
Eastern Mediterranean
Egypt’s cement industry recorded a renewed expansion in market activity during 2025, supported by improving demand conditions, regulatory oversight and a gradual rebalancing of supply and pricing dynamics across the domestic construction sector. Industry estimates indicate that domestic cement sales grew by 13%, reflecting the strong cement demand by virtue of the ongoing megaprojects. In addition, the changes in the building code which took place in late 2024, supported domestic demand growth. At the same time, Egypt has transformed into a major export hub in the Mediterranean and the neighboring region. While channeling surplus capacity, this also has exerted a positive stabilizing effect on prices. Cement exports from Egypt in 2025 grew by more than 40% reaching 11 million tonnes compared to almost zero exports just four years ago. The industry expects these to grow further in the years to come. All these, place Titan’s Alexandria plant in an ideally strategic position as it offers a direct port outlet while on the other, while it benefits from the construction boom on the country’s north coast. The Group is investing in additional storage capacity to enhance flexibility, allowing the plant to efficiently serve both domestic and export markets. At the same time, the Group is establishing three solid waste treatment facilities enabling it to produce alternative fuels, and thereby reducing its dependence on coal, and lowering its carbon emissions.
In Türkiye, policy normalization helped restore some stability through disinflation and the decline in interest rates while the weaker Lira boosted export activity. Tourism revenues continued to recover, while construction activity remained strong. Growing focus on seismic resilience has accelerated investment in the renewal of older housing stock, particularly around the Marmara region. Small and medium-sized private and public projects have maintained overall consumption at the same levels as last year, with our operations outperforming the overall market trend. The region recorded sales of €250.8 million, growing by 43.6% (LfL1), thanks to the turnaround in Egypt. EBITDA (LfL1) more than tripled, reaching €61.6 million.
Brazil (Joint Venture)
Domestic cement consumption in Brazil grew by 3.7% in 2025. In the Northeast region, where we operate, consumption rose by 7.2%, the highest regional performance in the country. This performance was supported by strong housing activity and infrastructure projects. Apodi prioritized margin expansion by optimizing its product mix, geographic allocation and sales strategy. Sales volume increased by 7% year-on-year, while Apodi achieved a significant increase in prices, reflecting successful commercial execution and pricing discipline. In 2025, Apodi’s sales reached €109 million versus €103 million in 2024, an increase of 7% (LfL1), (-1% reported), while EBITDA reached €32.8 million compared to €27.9 million, an increase of 17.4% (LfL1) compared to 2024 (+11.3% reported).
Digital Transformation
Digitalization continues to be a central strategic objective for TITAN, as the opportunities presented by Industry 4.0 are reshaping the cement industry. By harnessing big data, advanced analytics, and artificial intelligence, TITAN is a pioneer in digital transformation, particularly in cement manufacturing. These technologies are unlocking substantial value, driving operational efficiency, and positioning TITAN to compete effectively in a rapidly evolving market landscape.
In manufacturing, TITAN has prioritized the deployment of Artificial Intelligence-based Real-Time Optimizer (RTO) solutions across its cement manufacturing lines. These RTOs, developed both in-house and with external partners, are designed to maximize output per production asset and minimize energy consumption. By 2025, TITAN had installed RTOs in assets of all cement plants, advancing toward the Group’s goal of digitalizing 100% of cement manufacturing by 2026. TITAN has implemented a machine learning-based failure prediction system in all cement plants since 2023. This system, tailored to the unique operating environments of cement plants, enhances reliability and reduces the costs associated with unplanned maintenance. In 2025, TITAN began rolling out a new AI-driven cement quality prediction solution, following successful pilots in the USA that demonstrated rapid payback. CemAI, TITAN’s digital spin-off established in 2022, has continued to expand its customer base in 2025. CemAI offers “CemAI Predictive Maintenance,” a machine learning-based failure prediction service for other cement manufacturers, and “CemAI Process Optimizer,” an AI-enabled process optimization solution.
Digitalization of Ready-Mix Concrete (RMC) operations is a new strategic focus for TITAN. The company has developed a comprehensive set of RMC value chain use cases and launched new pilots for concrete quality prediction in 2025, while rolling out a mix design optimization solution, following successful pilots in 2024. In the integrated supply chain domain, TITAN has advanced its expertise in developing Advanced Analytics and AI-based tools for sales forecasting, distribution network optimization, and cement spare parts inventory management. The AI-enabled Dynamic Logistics solution, now fully deployed across all US Ready-Mix Concrete operations, enhances supply chain efficiency and customer satisfaction. Investments in telematics for truck fleets in the USA, Greece, and Southeastern Europe further support TITAN’s goal to digitalize concrete logistics by 2026. On the customer experience front, TITAN is transforming the operating model through digital channels. The introduction of SMS push notifications for concrete orders in selected US operations has improved customer experience through increased transparency. By the end of 2025, digital customer applications were active in 70% of business units, mainly in the USA, Southeastern Europe, Greece, W. Europe and Türkiye, with full coverage targeted by 2026.
TITAN’s digital transformation is underpinned by robust capability-building initiatives, including the Digital Academy in Greece and partnerships with not-for-profit organizations and academic and research institutions, as in the case of the TITAN Digital Accelerator (TDA), launched in Thessaloniki in 2024. In 2025, TDA focused on exploring new frontiers in robotics leveraged for plant monitoring and GenAI-enabled smart maintenance. The Group’s digital upskilling program, initiated in 2024, continues to expand, alongside a growing ecosystem of partners from start-ups, academia, equipment manufacturers, and specialist advisers.
ESG performance
In 2025, the Group achieved a further reduction in its specific net CO₂ emissions, which declined to 594 kg CO₂ per tonne of cementitious product, 12% below 2020 levels. This improvement was driven by a record-high alternative fuels Thermal Substitution Rate (TSR) of 22.3%, keeping TITAN firmly on track to meet its Science Based validated Targets (SBTi) targets. Lower‑carbon products accounted for 27.0% of total cement production, while absolute net CO₂ emissions decreased by 433,000 tonnes compared to 2024. CO₂ emissions per unit of revenue also fell to 3.51 kg CO₂/€, representing a 42% reduction versus 2020. To further accelerate decarbonization, TITAN invested €36 million in projects enhancing alternative fuels utilization, with several key plants achieving TSR levels between 40% and 65%, as well as in other decarbonization areas. The Group also continued to develop and to deploy innovative ultra‑low‑carbon cementitious products and to collaborate with partners such as CarbonUpcycling, Ecocem and Thyssenkrupp Polysius. The IFESTOS flagship carbon capture and storage project entered advanced development in 2025, with FEED studies underway, environmental permits secured, designation as a Strategic Investment by the Greek State, and infrastructure agreements in place to meet its energy requirements.
During 2025, TITAN also enhanced its ESG policies and received continued receiving strong external recognition. TITAN earned an “A” score from the Carbon Disclosure Project (CDP) for water security and an “A-” for climate change. The company achieved Prime status (B-) in the ISS ESG corporate rating, maintained its “AA” MSCI rating for a fifth consecutive year, scored 70 in the S&P Global Corporate Sustainability Assessment, and received a 98% ESG Transparency Score from the Athens Stock Exchange. TITAN remains a constituent of the FTSE4Good Index Series. For the second consecutive year, the Group was also recognized as one of Europe’s Climate Leaders by the Financial Times, listed among the World’s Most Sustainable Companies by TIME Magazine, and awarded the EUPD ESG Transparency Award.
Innovation updates
In 2025, we continued to invest through TITAN Ventures, our Group Venture Capital initiative, reaffirming our commitment to innovative construction and climate technologies and to visionary entrepreneurs. During the year, we deepened our engagement across the portfolio by deploying additional capital in Carbon Upcycling and investing in Zacua Ventures’ second fund, while also building stronger collaborations with our partners. A key milestone was an agreement with Carbon Upcycling to pilot its carbon utilization technology at industrial scale and assess its commercial feasibility, leveraging feedstock materials available at selected TITAN sites to produce local, high-performance, low‑carbon cementitious materials. We further expanded our hands-on involvement through pilot projects and technology deployments in new geographies, including the rollout of Concrete.ai’s mix design optimization solution across a broader Ready Mix Concrete operational base.
Outlook
In 2026, the global economy is expected to expand at a moderate pace, extending the resilience seen in the previous year, though geopolitical risks have increased. Inflation had been easing, supporting expectations for gradual monetary policy normalization; however, the escalation of the conflict in the Middle East has introduced new risks via higher energy prices, increased logistics’ costs and renewed supply chain uncertainty, which could slow the pace of interest rate cuts. Regional prospects for our markets remain mixed, with the US benefiting from resilient domestic demand in particular infrastructure, while Europe’s recovery is likely to remain more fragile given its greater exposure to energy price volatility.
The U.S. construction market is expected to remain broadly stable in 2026, amid elevated financing costs, persistent input inflation and ongoing labor constraints. Recent developments in energy pricing add further uncertainty to an already complex macroeconomic environment. Mortgage rates are expected to remain at elevated levels, continuing to weigh on housing affordability and residential activity, which is likely to remain subdued. As a result, the anticipated inflection point in residential construction may be pushed into 2027, with strong longer-term support from a structural housing supply gap. Industrial construction is expected to remain resilient in 2026, driven by manufacturing, energy and tech investments, mainly in the South. Infrastructure is a bright spot, with IIJA funding accelerating projects in Florida and the Mid-Atlantic. Strong bipartisan support is expected to result in the renewal of federal infrastructure funding at elevated levels later in the year.
Despite the near-term challenges, the markets where we operate are the beneficiaries of significant long-term demand tailwinds, including investments to replace and renew aging infrastructure, investments in manufacturing reshoring, and emerging trends in resilient urbanization and construction technology. We see strong opportunities in high-demand markets and are meeting these opportunities with targeted investments in capacity expansion, logistics, and adjacencies. Finally, the integration of Keystone acquisition (subject to regulatory approval), later in 2026, will add substantial domestic cement production capacity, expand our geographic reach and further strengthen our position along the East Coast and inland.
Greece’s construction sector is set for moderate growth, supported by resilient private demand and strong public investment. With GDP expected to grow in 2026–27 at twice the EU average, momentum in Greece is underpinned by RRF funding, supporting investment activity. Residential construction remains buoyant, driven by a housing shortage and new supply-side policies. Public infrastructure will lead growth, backed by EU-funded transport, energy, and post-disaster reconstruction projects. Commercial and industrial segments are also benefiting from robust investment, particularly in tourism, manufacturing, and renewables.
In 2026, the construction sector across Southeastern Europe’s markets is expected to stabilize at high levels, following several years of robust expansion. Residential construction remains a key driver of demand, supported by urbanization, housing shortages and diaspora-related investments; however, elevated financing costs are tempering new homebuilding. Private non residential construction is following a two speed‑ trajectory. On the one hand, strong foreign and domestic investment is driving industrial and energy projects, including new manufacturing facilities and large‑scale renewable power installations, particularly in North Macedonia. On the other hand, marquee events such as Serbia’s upcoming EXPO 2027 are catalyzing a surge in related commercial developments. Public infrastructure is expected to be the most dynamic segment, underpinned by large‑scale transport and energy projects supported by EU and multilateral funding, including Bulgaria’s Recovery and Resilience Plan and Western Balkans investment programs.
In 2026, Egypt and Türkiye’s construction sectors are set for moderate growth, driven by expansive development pipelines -Egypt’s alone exceeding $565 billion- despite ongoing affordability and financing challenges. Easing inflation and improved FX stability should support Egypt’s economy, while Türkiye benefits from resilient domestic demand and a gradual policy shift. Residential construction remains a key growth engine in both countries, fueled by population growth, housing shortages, and large-scale reconstruction (post-earthquake) and renewal programs, while cost inflation and financing constraints persist. Industrial and energy megaprojects, along with rising FDI and decarbonization efforts, are boosting private non residential activity. Public infrastructure will also play a central role, supported by sustained government and Public Private Investment programs in both countries.
Our regional teams have demonstrated agility through adaptive pricing and strong ‑cross functional coordination, supported by a solid balance sheet and disciplined cost management. We continue to embed AI across operations to enhance productivity, while our inorganic growth strategy remains anchored to EBITDA margin and ROACE targets. The current conflict in the Middle East creates geopolitical uncertainties with macroeconomic implications the extent of which cannot yet be fully assessed. TITAN Group has no exposure to the affected regions. Nevertheless, conflict-driven developments, including higher energy prices, are anticipated to impact market trends and further increase inflationary risks. Looking ahead to 2026, we expect low single-digit (LfL) sales growth and mid-single-digit (LfL) EBITDA growth, supported by resilient pricing, and productivity and efficiency initiatives. Additionally, the integration of our latest acquisitions, will further drive growth. Capital expenditures are expected to range between €350 million and €400 million, focused on growth and efficiency initiatives, consistent with recent years.
Consolidated Income Statement |
||||
|
|
|
|
|
(all amounts in Euro thousands) |
|
Year ended 31 December |
||
|
2025 |
|
2024 |
|
|
|
|
|
|
Sales |
|
2,669,006 |
|
2,644,040 |
Cost of sales |
|
-1,934,721 |
|
-1,942,187 |
Gross profit |
|
734,285 |
|
701,853 |
Other operating income |
|
10,773 |
|
11,266 |
Administrative expenses |
|
-269,497 |
|
-257,419 |
Selling and marketing expenses |
|
-39,516 |
|
-40,005 |
Net impairment losses on financial assets |
|
-1,749 |
|
383 |
Other operating expenses |
|
-363 |
|
-1,795 |
Profit before impairment losses on goodwill, net finance costs and taxes |
|
433,933 |
|
414,283 |
Impairment losses on goodwill |
|
– |
|
-17,004 |
Operating profit |
|
433,933 |
|
397,279 |
Loss on disposal of subsidiaries |
|
-52,080 |
|
– |
Gain on net monetary position in hyperinflationary economies |
|
1,384 |
|
8,293 |
Finance income |
|
13,751 |
|
10,154 |
Finance expenses |
|
-42,849 |
|
-46,512 |
Loss from foreign exchange differences |
|
-9,828 |
|
-1,629 |
Net finance costs |
|
-37,542 |
|
-29,694 |
Share of profit of associates and joint ventures |
|
6,665 |
|
7,986 |
Profit before taxes |
|
350,976 |
|
375,571 |
Income taxes |
|
-93,350 |
|
-85,316 |
Profit after taxes |
|
257,626 |
|
290,255 |
|
|
|
|
|
Attributable to: |
|
|
|
|
Equity holders of the parent |
|
236,291 |
|
289,160 |
Non-controlling interests |
|
21,335 |
|
1,095 |
|
|
257,626 |
|
290,255 |
|
|
|
|
|
Basic earnings per share (in €) |
|
3.1765 |
|
3.8858 |
Diluted earnings per share (in €) |
|
3.1526 |
|
3.8568 |
|
|
|
|
|
Earnings before interest, taxes, depreciation, amortization and impairment (EBITDA) |
||||
|
|
|
|
|
(all amounts in Euro thousands) |
|
Year ended 31 December |
||
|
|
2025 |
|
2024 |
|
|
|
|
|
Profit before impairment losses on goodwill, net finance costs and taxes |
|
433,933 |
|
414,283 |
Depreciation and amortization |
|
172,147 |
|
165,842 |
Earnings before interest, taxes, depreciation, amortization and impairment (EBITDA) |
|
606,080 |
|
580,125 |
Condensed Consolidated Statement of Financial Position |
||||
|
|
|
|
|
(all amounts in Euro thousands) |
|
31.12.2025 |
|
31.12.2024 |
|
|
|
|
|
Assets |
|
|
|
|
Property, plant & equipment (PPE) and investment property |
|
1,678,830 |
|
1,825,188 |
Intangible assets and goodwill |
|
352,523 |
|
370,714 |
Investments in associates and joint ventures |
|
134,546 |
|
105,843 |
Other non-current assets |
|
62,538 |
|
25,567 |
Deferred tax assets |
|
5,035 |
|
4,732 |
Total non-current assets |
|
2,233,472 |
|
2,332,044 |
|
|
|
|
|
Inventories |
|
405,208 |
|
442,186 |
Receivables, prepayments and other current assets |
|
373,786 |
|
385,064 |
Cash and cash equivalents |
|
483,558 |
|
123,283 |
Total current assets |
|
1,262,552 |
|
950,533 |
|
|
|
|
|
Total Assets |
|
3,496,024 |
|
3,282,577 |
|
|
|
|
|
Equity and Liabilities |
|
|
|
|
Equity and reserves attributable to owners of the parent |
|
1,954,427 |
|
1,787,064 |
Non-controlling interests |
|
129,311 |
|
37,449 |
Total equity (a) |
|
2,083,738 |
|
1,824,513 |
|
|
|
|
|
Long-term borrowings and lease liabilities |
|
582,308 |
|
662,196 |
Deferred tax liability |
|
144,703 |
|
149,606 |
Retirement benefit obligations |
|
25,170 |
|
23,875 |
Provisions |
|
66,046 |
|
65,994 |
Other non-current liabilities |
|
35,953 |
|
18,861 |
Total non-current liabilities |
|
854,180 |
|
920,532 |
|
|
|
|
|
Short-term borrowings and lease liabilities |
|
114,781 |
|
83,135 |
Trade, income tax and other payables |
|
433,120 |
|
436,106 |
Provisions |
|
10,205 |
|
18,291 |
Total current liabilities |
|
558,106 |
|
537,532 |
|
|
|
|
|
Total liabilities (b) |
|
1,412,286 |
|
1,458,064 |
|
|
|
|
|
Total Equity and Liabilities (a+b) |
|
3,496,024 |
|
3,282,577 |
| Condensed Consolidated Cash Flow Statement | ||||
|
|
|
|
|
(all amounts in Euro thousands) |
|
Year ended 31 December |
||
|
|
2025 |
|
2024 |
Cash flows from operating activities |
|
|
|
|
Profit after taxes |
|
257,626 |
|
290,255 |
Depreciation, amortization and impairment of assets |
|
172,147 |
|
182,846 |
Interest and related expenses |
|
23,749 |
|
35,546 |
Income taxes |
|
93,350 |
|
85,316 |
Other non-cash items |
|
89,147 |
|
21,213 |
Changes in working capital |
|
-24,586 |
|
-65,094 |
Cash generated from operations |
|
611,433 |
|
550,082 |
Income tax paid |
|
-79,579 |
|
-97,310 |
Net cash generated from operating activities (a) |
|
531,854 |
|
452,772 |
|
|
|
|
|
Cash flows from investing activities |
|
|
|
|
Payments for PPE and intangible assets |
|
-284,976 |
|
-250,620 |
Proceeds from sale of PPE, intangible assets and investment property |
|
5,279 |
|
3,156 |
Proceeds from dividends |
|
1,368 |
|
1,319 |
Proceeds from disposal of subsidiary, net of cash disposed |
|
71,467 |
|
– |
Payments for acquisition of subsidiaries and associates, net of cash acquired |
|
-22,873 |
|
-13,584 |
Net proceeds from changes in investments to affiliates and other investing activities |
|
596 |
|
3,761 |
Net cash flows used in investing activities (b) |
|
-229,139 |
|
-255,968 |
|
|
|
|
|
Cash flows from financing activities |
|
|
|
|
Proceeds from non-controlling interest’s participation in subsidiary’s share capital increase/establishment |
|
346,957 |
|
– |
Payments due to share capital return |
|
-3,400 |
|
– |
Dividends paid to equity holders of the parent |
|
-223,551 |
|
-63,408 |
Dividends paid to non-controlling interests |
|
-754 |
|
-2,303 |
Payments for treasury shares purchased |
|
-15,337 |
|
-22,443 |
Proceeds from sale of treasury shares |
|
171 |
|
488 |
Interest and other related charges paid |
|
-37,445 |
|
-43,952 |
Net proceeds/(payments) from drawn downs of credit facilities and derivatives |
|
14,886 |
|
-212,481 |
Bank term deposit |
|
– |
|
80,000 |
Net cash flows from/(used in) financing activities (c) |
|
81,527 |
|
-264,099 |
|
|
|
|
|
Net increase/(decrease) in cash and cash equivalents (a)+(b)+(c) |
|
384,242 |
|
-67,295 |
|
|
|
|
|
Cash and cash equivalents at beginning of the year |
|
123,283 |
|
194,525 |
Effects of exchange rate changes |
|
-23,967 |
|
-3,947 |
Cash and cash equivalents at end of the year |
|
483,558 |
|
123,283 |
ESG Performance Indicators
|
|
|
2025 |
|
2024 |
Scope 1 net CO2 emissions3 |
kg/t cementitious product |
594.3 |
598.4 |
||
Scope 2 CO2 emissions3 |
kg/t cementitious product |
38.1 |
42.8 |
||
Scope 3 CO2 emissions3 |
kg/t cementitious product |
117.2 |
128.1 |
||
Alternative fuel substitution rate3 |
% heat |
22.3 |
21.2 |
||
Clinker-to-cement ratio3 |
% |
76.9 |
76.5 |
||
Fatalities |
# |
|
2 |
|
0 |
Employee Lost Time Injuries Frequency Rate (LTIFR) |
#/106 h |
0.41 |
0.33 |
||
Well-being initiatives |
# |
382 |
368 |
||
Share of women in management |
% |
21.5 |
21.2 |
||
Share of women in new hires |
% |
16.7 |
15.5 |
||
Average training hours per employee1 |
h/employee |
23.8 |
26.5 |
||
Dust emissions2 |
g/t clinker |
19.6 |
21.7 |
||
NOx emissions2 |
g/t clinker |
1,314 |
1,149 |
||
SOx emissions2 |
g/t clinker |
246.3 |
233.7 |
||
Sites (quarries) with biodiversity management plans |
% |
100 |
100 |
||
Total number of Community Initiatives |
# |
314 |
297 |
||
Internships1 |
# |
285 |
365 |
||
Employees from local community1 |
% |
|
83.9 |
|
83.7 |
Local spend |
% |
74.1 |
68.4 |
||
Water consumption2 |
l/t cementitious product |
229.9 |
220.9 |
||
Water demand covered by recycled water2 |
% |
71.6 |
72.9 |
||
Percentage of production covered by ISO 50001 or energy audits2 |
% |
90 |
90 |
||
Female representation on the Board of Directors |
# |
1/3 |
1/3 |
||
Independent Board members |
# |
7/12 |
9/16 |
Notes
1The metric is not part of TITAN’s sustainability statement as it’s not required by ESRS. Therefore, this will not be subject to a limited assurance report in accordance with ISAE 3000 (Revised).
2Reporting boundaries include all financially consolidated entities of cement activities, with the exception of Adoçim where an equity share of 75% has been applied and for the first 5 months of FY2025 due to the divestment.
3Reporting boundaries include all financially consolidated entities of cement activities, with the exception of Adoçim where an equity share of 75% has been applied, plus 50% of a non-consolidated joint venture in Brazil as per our SBTi validated targets.
4CO₂ emissions per unit of revenue metric is not part of TITAN’s sustainability statement as it’s not required by ESRS. Therefore, this will not be subject to a limited assurance report in accordance with ISAE 3000).
General Definitions |
||||
Measure |
|
Definition |
|
Purpose |
|
|
|
|
|
CapEx |
|
Acquisitions/additions of property, plant and equipment, right of use assets, investment property and intangible assets |
|
Allows management to monitor the capital expenditure |
EBITDA |
|
Profit before impairment losses on goodwill, net finance costs and taxes plus depreciation, amortization and impairment of tangible and intangible assets and amortization of government grants |
|
Provides a measure of operating profitability that is comparable among reportable segments consistently |
EBITDA (LfL) |
|
EBITDA adjusted for foreign exchange effects and scope changes. In 2025, scope effects include the sale of Adocim |
|
Provides a measure of operating profitability that is comparable among reportable segments consistently |
Net debt |
|
Sum of long-term borrowings and lease liabilities, plus short-term borrowings and lease liabilities (collectively gross debt), minus cash, cash equivalents and bank term deposits |
|
Allows management to monitor the indebtedness |
NPAT |
|
Profit after tax attributable to equity holders of the parent |
|
Provides a measure of total profitability that is comparable over time |
NPAT (LfL) |
|
NPAT adjusted for foreign exchange effects and scope changes. In 2025, scope effects include the sale of Adocim and the non-controlling interest to Titan America S.A.. In 2024, scope effects include the goodwill impairment in Türkiye and the recognized deferred tax asset in Brazil |
|
Provides a measure of total profitability that allows comparability between reporting periods |
Earnings per share (LfL) |
|
NPAT (LfL) divided by the weighted average number of shares in issue during the year, excluding shares purchased and held as treasury shares |
|
Provides a measure of profitability on a per-share basis that is comparable over time |
Operating free cash flow |
|
Net cash generated from operating activities plus interest received, minus payments of tax, interest and other related charges |
|
Measures the capability of the Group in turning profit into cash through the management of operating cash flow and capital expenditure |
Profit before impairment losses on goodwill, net finance costs and taxes |
|
Profit before income tax, share of gain or loss of associates and joint ventures, net finance costs and impairment losses on goodwill |
|
Provides a measure of operating profitability that is comparable over time |
ROACE |
|
Operating profit divided by average capital employed (average annual net debt plus equity) |
|
Assists management in monitoring the efficiency of the capital employed |
Sales (LfL) |
|
Sales adjusted for foreign exchange effects and scope changes. In 2025, scope effects include the sale of Adocim |
|
Provides a measure of sales that allows comparability between reporting periods |
Financial Calendar
27 March 2026 |
Publication of the Integrated Annual Report 2025 |
7 May 2026 |
Annual General Meeting of Shareholders |
7 May 2026 |
Publication of the first quarter 2026 results |
30 July 2026 |
Publication of the second quarter and half year 2026 results |
5 November 2026 |
Publication of the third quarter and nine months 2026 results |
- This press release may be consulted on the website of Titan SA via the below link: https://ir.titanmaterials.com/en/regulatory-stock-exchange-announcements
- For further information, please contact Investor Relations at +30 210 2591 257
- An analyst call will be held on March 19th at 15:00 CET, please see: https://87399.themediaframe.eu/links/titan260319.html
- The statutory auditor, PwC Bedrijfsrevisoren BV/PwC Reviseurs d’Entreprises SRL, represented by Didier Delanoye, acting on behalf of Didier Delanoye BV, has confirmed that the audit, which is substantially complete, has not to date revealed any material misstatement in the draft consolidated accounts, and that the accounting data reported in this press release is consistent, in all material respects, with the draft consolidated accounts from which it has been derived.
- The statutory auditor has confirmed that its limited assurance procedures, which are substantially complete for the sustainability data reported in this press release, have to date not revealed any significant matters requiring adjustment to the sustainability data as of and for the year ended 31 December 2025 included in this press release, and that the consolidated sustainability data reported in the press release are consistent, in all material respects, with the draft consolidated sustainability statement from which they have been derived.
DISCLAIMER: This report may include forward-looking statements. Forward-looking statements are statements regarding or based upon our management’s current intentions, beliefs or expectations relating to, among other things, TITAN Group’s future results of operations, financial condition, liquidity, prospects, growth, strategies or developments in the industry in which we operate. By their nature, forward-looking statements are subject to risks, uncertainties and assumptions that could cause actual results or future events to differ materially from those expressed or implied thereby. These risks, uncertainties and assumptions could adversely affect the outcome and financial effects of the plans and events described herein. Forward-looking statements contained in this report regarding trends or current activities should not be taken as a report that such trends or activities will continue in the future. We undertake no obligation to update or revise any forward-looking statements, whether as a result of new information, future events or otherwise. You should not place undue reliance on any such forward-looking statements, which speak only as of the date of this report. The information contained in this report is subject to change without notice. No re-report or warranty, express or implied, is made as to the fairness, accuracy, reasonableness or completeness of the information contained herein and no reliance should be placed on it. In most of the tables of this report, amounts are shown in € million for reasons of transparency. This may give rise to rounding differences in the tables presented in the trading update. This trading update has been prepared in English and translated into French and Greek. In the case of discrepancies between the two versions, the English version will prevail.
About TITAN Group
TITAN Group is a Belgium-registered company and a leading international business in the building and infrastructure materials industry, with passionate teams committed to providing innovative solutions for a better world. With most of its activity in the developed markets, the Group employs more than 6,000 people and serves customers in over 25 markets, on four continents. It holds prominent positions in the United States, Europe – including Greece, the Balkans, the United Kingdom, Italy, and France – and the Eastern Mediterranean. The Group also has joint ventures in Brazil and India. With more than 120 years of history, TITAN has always fostered a family-and entrepreneurial-oriented culture for its employees and works tirelessly with its customers to meet the modern needs of society while promoting sustainable growth with responsibility and integrity. TITAN has set a net-zero goal for 2050 and has its CO₂ reduction targets validated by the Science Based Targets initiative (SBTi). The Group is listed on Euronext Brussels and Paris, and the Athens Exchange, and its US business is listed on the NYSE. For more information, visit our website at www.titanmaterials.com.
View source version on businesswire.com: https://www.businesswire.com/news/home/20260319046173/en/
Contact
UK-First AI Case-Finding Pathway Launched to Improve Early Detection of Oesophageal and Gastric Cancer
A new NHS-first, AI-enabled case-finding pathway has launched across North East Essex, aiming to improve the early detection of Oesophageal and stomach cancers, some of the hardest cancers to diagnose early and among those with the poorest outcomes in England.
Delivered in partnership between AstraZeneca, C the Signs, NHS Suffolk and North East Essex Integrated Care Board, Health Innovation East and GP Primary Choice, the programme represents the first time in England that population-level, AI-driven case finding has been implemented in primary care for Oesophageal and stomach cancers. C the Signs is a UK-developed, AI-powered clinical platform that enables the earliest and most accurate detection of cancer across more than 100 cancer types.
Upper gastrointestinal cancers do not currently have a national screening programme and often present with vague, non-specific symptoms. As a result, many patients are diagnosed at a late stage, when treatment options are limited, and outcomes are poor. In England, around four in five oesophageal and stomach cancers are diagnosed at an advanced stage, with survival strongly linked to how early the cancer is detected. This new pathway is designed to address that gap.
A proactive approach to finding risk earlier
“Upper gastrointestinal cancers are some of the hardest cancers to detect early, opportunities for earlier diagnosis are frequently missed,” said Dr Bea Bakshi, GP and Co-Founder of C the Signs. “This pathway supports earlier identification of risk and faster access to diagnostics, giving more patients the chance to be diagnosed when treatment is more effective.”
The pathway is implemented in primary care using the C the Signs platform, a UKCA-marked Class I medical device founded by NHS doctors. The technology analyses routinely collected clinical data within the electronic health record, alongside patient-reported information, to identify patients who may be at increased risk of cancer.
Eligible patients are proactively invited by SMS to complete a short digital assessment to evaluate symptoms and risk factors. Where cancer risk is identified, patients are rapidly triaged to the most appropriate diagnostic pathway, including capsule sponge testing, endoscopy, or CT scanning, depending on clinical presentation. As the delivery partner, GP Primary Choice ensures this model is operationalised effectively across practices, supporting consistent neighbourhood‑level implementation and enabling adoption at scale.
By supporting earlier identification and faster access to diagnostics, the pathway aims to detect more Oesophageal and stomach cancers at a stage when treatment is more effective and outcomes are improved.
C the Signs already supports more than 1,500 GP practices across England and is used by over 11,000 healthcare professionals. This new service builds on that existing NHS infrastructure to introduce a targeted, population-based approach to cancers that have historically been difficult to detect early.
Aligned with the National Cancer Plan
The launch follows the publication of the National Cancer Plan for England, which sets out a clear ambition to improve early diagnosis through proactive case finding, better use of electronic health record data, and primary care-led pathways that identify patients at highest risk earlier. The programme also reflects the increasing importance of neighbourhood‑level delivery and the role of GP federations in enabling consistent, scalable implementation across local systems.
The plan highlights the importance of moving from reactive diagnosis to more predictive, risk-based approaches, particularly for cancers without established screening programmes. This programme directly reflects those priorities, using data and technology to support earlier action and reduce avoidable delays in diagnosis.
Anna Arent, Head of Oncology, AstraZeneca UK
“We are delighted to embark on this new partnership, bringing transformative AI technology into our first pilot in gastrointestinal cancers. As reinforced in the recent publication of the National Cancer Plan, early detection is one of the most powerful ways we can change outcomes for patients, and innovations like this have the potential to identify cancer earlier, when it is most treatable. Primary care plays a critical role in the diagnosis pathway, and by equipping frontline clinicians with advanced tools that support fast and accurate decision making, we can help diagnose more people at the right time and in the right setting. This collaboration reflects AstraZeneca’s commitment to accelerating earlier diagnosis through meaningful partnerships, taking us a step closer to one day eliminating cancer as a cause of death.”
Diagnostics through the pathway will be delivered across communities in a primary care setting by GP Primary Choice, helping to bring investigations closer to patients homes while reducing pressure on acute hospital services.
Dr Peter Holloway, GP Cancer Lead for SNEE ICB and clinical lead for the project, said:
“We have developed unique and extensive local experience in community capsule sponge testing to improve diagnosis of oesophageal cancer. This project builds on our previous work but extends the scope to include all upper gastrointestinal cancers, including stomach and pancreas.
“By integrating local health data with service planning and using AI to group symptoms reported by patients, we hope to increase early cancer detection and thereby improve outcomes for cancers which currently can have a poor prognosis. This is one of the key priorities for the ICB and aligns with the new National Cancer Plan.”
This approach aligns with national policy ambitions to shift more care into neighbourhood and community settings, improving access, convenience, and patient experience.
Dave Chuter; OG cancer patient, Chair of ICPV (Independent Cancer Patients’ Voice) and Chair DiCE (Digestive Cancers Europe) said:
“As an Oesophageal cancer patient with lived experience, I’ve seen from my support group network how first-hand how people with upper gastrointestinal cancers are too often diagnosed late, not because they didn’t seek help, but because the signs are difficult to recognise and easy to overlook as an everyday result of day to day life.
“What’s encouraging about this approach is that it doesn’t wait for patients to reach a crisis point. Using AI to proactively identify risk and invite people in for assessment is a meaningful and beneficial shift towards earlier diagnosis. For patients, that can mean more treatment options, more time, and a better chance of a positive outcome.
“Just as importantly, delivering this through primary care and closer to home makes access easier and more open to everyone, which is something patients consistently tell us is so important.”
About C the Signs
C the Signs instantly assesses cancer risk using advanced AI, existing medical records, and patient-reported data (no new tests or imaging required). The platform continuously updates each patient’s risk profile over time, catching cancer even before symptoms appear or raise clinical concern. Finding cancer early can transform the prognosis, giving people more possibilities for effective care and more healthy years. Doctors Bea Bakshi and Miles Payling founded the company in 2017 after seeing firsthand the difference that early diagnosis can make to a patient’s life. C the Signs has detected cancer in over 70,000 patients and recognizes a new patient with cancer every 22 minutes. Validated by Mayo Clinic, the company is backed by investors including Khosla Ventures, MMC, Ataraxia, and Acequia Capital. Clinicians, patients, families, and health systems can learn more about free, early detection at https://www.cthesigns.com/.
View source version on businesswire.com: https://www.businesswire.com/news/home/20260319833948/en/
Contact
Luke Wyatt, C The Signs, lukewyatt@cthesigns.net
Granite Underwriting Launches 25+ Vehicle Taxi Fleet Product
Granite Underwriting has today launched its 25+ vehicle taxi fleet product, bringing expanded capacity and specialist expertise to brokers serving taxi fleet operators across the UK.
The product covers private hire and public hire vehicles, including those written on CCE, Book & Bonus and new ventures. As part of Acorn Group – the UK’s leading taxi insurer – Granite gives brokers access to more than four decades of taxi market experience and a fully integrated service from underwriting through to claims resolution.
A core feature of the product is Granite’s dedicated taxi fleet claims team. Managed entirely in‑house, brokers and their clients can benefit from specialist claims handlers, reducing vehicle downtime, keeping hire and repair costs down, reducing clients’ CCEs and enabling them to secure a lower price at renewal. This end-to-end capability sets Granite apart in a market where claims service can make or break a fleet operator’s business.
The product also caters to non-standard and complex risks, including drivers with multiple motoring convictions, previous claims history and high-risk postcodes. Optional long-term agreements are available for taxi fleets seeking price stability and reduced annual negotiation.
Alistair Rose, Managing Director at Granite Underwriting, said:
“This launch underlines our ongoing commitment to the taxi fleet market. We’ve built our reputation on designing tailored solutions for complex risks, and our in-house claims team means we can support taxi fleet operators from policy inception through to claims settlement.
“As the UK’s leading taxi insurer, we combine years of sector experience with a deep understanding of what taxi drivers and fleet owners need – a combination that positions us well to serve larger 25+ vehicle fleets.
“Brokers tell us they value direct access to underwriters who understand their client’s business and can structure products to meet specific requirements. That practical, market-facing approach helps speed placements and delivers better outcomes for operators and drivers alike.”
The product is available to brokers immediately.
About Granite Underwriting
Granite Underwriting is Acorn Group’s managing general agent, underwriting and distributing motor, taxi and household insurance through a nationwide network of more than 200 broker partners. It provides specialist underwriting expertise and market access for non-standard risks, supporting Acorn’s proposition with focused product lines and strong broker relationships.
About Acorn Group
Merseyside-based Acorn Group is one of the UK’s leading non-standard providers of car, van, taxi and household insurance to retail customers, serving more than 500,000 live policyholders nationwide and employing over 1,800 colleagues. Acorn operates through its portfolio of brands – Acorn Insurance, Carrot, Motorcade, Flag, Rapid, Briefly and Street Cover – alongside Granite Underwriting and its network of 200 brokers.
View source version on businesswire.com: https://www.businesswire.com/news/home/20260319368753/en/
Contact
Media contact:
Nathalie Crystal
Associate Director, Omnia Partners
M: (+44) (0) 7967 046 327
E: nathalie.crystal@weareomniapartners.com
Veyco and Entrust Deliver the First Integrated QES with Standards-Aligned Identity Verification for UK Property Transactions
Entrust, a global leader in trusted identity-centric security solutions, and Veyco, the property fraud protection company, today announced a partnership that brings fully digital and secure document signing to the property market. The integrated solution combines ETSI TS 119 461-certified identity verification and QTSP-issued Qualified Electronic Signatures (QES) into Veyco’s Know Your Customer (KYC) platform to enable digital signing of contracts and legal documents. The partnership helps property professionals operate within the UK’s evolving regulatory and Land Registry framework while strengthening fraud prevention and delivering a seamless digital experience.
The launch comes at a pivotal time for the market following HM Land Registry’s action to accept QES and encouraged the industry to adopt them for “greater security and ease for anyone involved in buying or selling residential or commercial property.”
Under the UK eIDAS regulation, a Qualified Electronic Signature has the equivalent legal effect of a handwritten signature1. The integrated solution from Veyco and Entrust strengthens security and compliance by helping property professionals meet anti-money laundering (AML), Know Your Customer (KYC), and eIDAS requirements through electronic signing and AI-powered identity verification. It removes the need for paperwork, in-person appointments, and witnessed signatures, significantly streamlining processes for conveyancers, lawyers, estate agencies, buyers, and sellers.
The solution accelerates transactions by digitizing the entire workflow and eliminating manual processes such as printing, posting, scanning, and administrative follow-ups. Together, this creates a streamlined user experience, enabling clients to complete processes quickly and securely within a single digital workflow.
“Through collaboration with Entrust, HM Land Registry, and Your Conveyancer, we are making property transactions more secure and efficient for our clients,” said Simon Hughes, CTO and Director at Veyco. “Nationwide Building Society, one of the UK’s largest mortgage lenders, has become the first lender to leverage the integrated solution to enable a mortgage deed to be signed electronically, removing the need for a witness and wet-ink signature.”
“QES and AI-powered identity verification are redefining how the property market combats fraud and accelerates transactions,” said Minh Nguyen, VP Identity Security at Entrust. “Our partnership with Veyco delivers a single, secure solution that empowers banks, mortgage lenders, estate agents, conveyancers, and legal firms to verify users with confidence and execute documents digitally with legal standing. Trust is defined in the moments of truth when access is granted, actions are decided, and identity is verified. By designing security around these moments of truth, organizations can better mitigate fraud and streamline digital experience for everyone.”
Within the Veyco app, signers verify their identity by capturing a photo of their government-issued identity document (ID) and a short selfie video. The Entrust identity verification solution checks the ID for authenticity and matches the biometric features to confirm the individual presenting the ID is the legitimate owner and is physically present. Once verified, users can immediately review and sign documents digitally. A qualified certificate is issued by Namirial, the Qualified Trust Service Provider (QTSP) partner for Entrust, and a qualified electronic signature is applied to the document, protecting it from tampering and binding the signature to the verified signer. The signed document is delivered directly to the solicitor or agent – all within minutes and entirely in the Veyco app.
About Entrust:
Entrust fights fraud and cyber threats with identity-centric security that protects people, devices, and data. Our comprehensive solutions help organizations secure every step of the identity lifecycle, from verifying identity at onboarding to securing connections and fighting fraud in everyday transactions. Ongoing monitoring supports compliance and safeguards keys, secrets, and certificates. With a foundation of identity-centric security, our customers can transact and grow with confidence. Entrust has a global partner network and supports customers in over 150 countries. For more information, visit www.entrust.com.
About Veyco:
Veyco is dedicated to preventing property fraud by integrating identity verification, Anti-Money Laundering (AML) screening, source of funds checks, and QES into a single, seamless workflow. The solution helps law firms, estate agents, housing providers, and other stakeholders complete transactions securely and in compliance with UK regulations—without adding complexity for its clients.
1 Subject to applicable sector-specific requirements.
View source version on businesswire.com: https://www.businesswire.com/news/home/20260317259377/en/
Contact
Abstract
Veyco and Entrust join forces to power Qualified Electronic Signatures with AI-powered identity verification for secure, digital document signing.
TweetText
QES and AI-powered identity verification are redefining how the property market combats fraud and accelerates transactions.
REPLY Unveils the New Editions of the Reply AI Music Contest and Reply AI Film Festival under the Theme “Imaginatio Nova”
Reply [EXM, STAR: REY, ISIN: IT0005282865] confirms its commitment for 2026 to fostering dialogue between creativity, technology and artificial intelligence through the Reply AI Music Contest and the Reply AI Film Festival, the two international AI competitions open to creatives, filmmakers, musicians and innovation professionals from around the world. The theme of the 2026 edition, “Imaginatio Nova”, is an invitation to explore a new phase of imagination, where human creativity is renewed through technology. This approach views artificial intelligence not as a substitute for artistic talent, but as a catalyst for new visions, languages and expressive possibilities, capable of generating forms that did not previously exist.
This press release features multimedia. View the full release here: https://www.businesswire.com/news/home/20260319315132/en/

“Today, artificial intelligence technologies applied to the generation of audiovisual and music content are reaching extraordinary levels of quality and realism. What remains central, however, is vision: the creative idea and the ability to imagine new stories and worlds. With the Reply AI Music Contest and the Reply AI Film Festival, we aim to offer a space for experimentation open to talent from around the world and, at the same time, a privileged vantage point to observe how human creativity and artificial intelligence are evolving together, giving rise to new forms of artistic expression”, commented Filippo Rizzante, CTO Reply.
The Reply AI Music Contest, organised in collaboration with Kappa FuturFestival, one of Europe’s leading festivals dedicated to electronic music and digital arts, is dedicated to sound and musical experimentation through the use of artificial intelligence. The competition invites musicians and producers to explore new ways of composing, producing and performing, bringing together creativity, technology and contemporary culture. The Reply AI Film Festival, focuses on cinematic language and audiovisual storytelling. The competition will culminate in the official premiere of the finalist short films at an event organised by Reply and Mastercard, taking place in September in Venice. The entries will be evaluated by an outstanding jury composed of leading professionals from the worlds of cinema, music, creativity and technological innovation.
Alongside the “AI for Good Award” – promoted in collaboration with the International Telecommunication Union (ITU) and dedicated to the best short film highlighting the United Nations Sustainable Development Goals (SDGs) – the third edition of the Reply AI Film Festival introduces another special prize, the “Reply AI Studios Grand Prix.” This award, celebrating innovation and excellence in the use of artificial intelligence, will also be featured in the second edition of the Reply AI Music Contest. In both competitions, the prize will be awarded to the artists who best combine bold storytelling with AI engineering, achieving professional quality and production speed through responsible and transparent practices.
Creative talents from around the world can take part in the Reply AI Music Contest and the Reply AI Film Festival by submitting their works via the dedicated platforms aimc.reply.com and aiff.reply.com by 1 June 2026.
These initiatives are part of the Reply Challenges, a programme of technological and creative competitions that reflects Reply’s commitment to developing innovative educational models capable of engaging new generations. Today, the Reply Challenges community includes more than 150,000 participants worldwide and continues to expand with new initiatives, such as the recently launched AI Agent Challenge. On April 16, participants from around the world will have six hours to design and implement AI agents capable of collaborating to solve a real-world case. Registrations are open on the dedicated platform, which also includes training content and simulations to help participants prepare for the challenge.
Reply
Reply [EXM, STAR: REY, ISIN: IT0005282865] specialises in the design and implementation of solutions based on new communication channels and digital media. As a network of highly specialised companies, Reply supports major industrial groups in the telecom and media; industry and services; banking and insurance and public sectors in defining and developing business models enabled by the new paradigms of AI, cloud computing, digital media and the internet of things. Reply’s services include: consulting, system integration and digital services. www.reply.com
View source version on businesswire.com: https://www.businesswire.com/news/home/20260319315132/en/
Contact
Media:
Reply
Fabio Zappelli
f.zappelli@reply.com
Tel. +390117711594
Irene Caia
i.caia@reply.com
Tel. +3902545761