Slumping economy, surging stock market– what’s going on?

While tens of millions of Americans were losing their jobs, the stock market in April produced its best monthly return in over 30 years. We look at what’s behind this apparent disconnect.
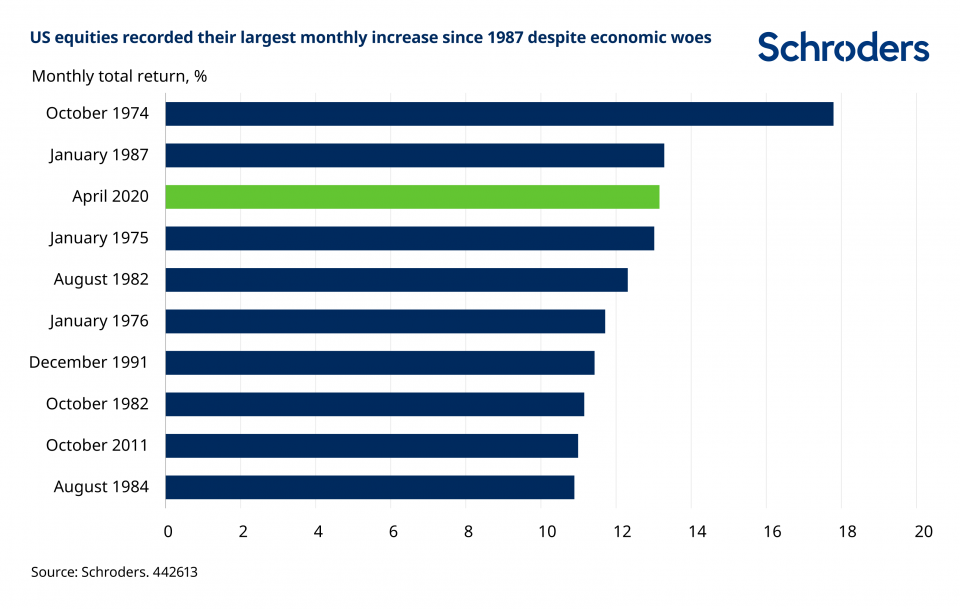
36 million Americans filed for unemployment claims over the past eight weeks. US GDP plunged by 4.8 per cent in the first quarter of 2020. Yet the US stock market surged by 13.2 per cent in April, the largest monthly increase since 1987.
What on earth is going on? Why is the market moving in the opposite direction to the economy?

Past performance is not a guide to future performance and may not be repeated.
Source: Refinitiv Datastream and Schroders. Notes: US equities = MSCI USA Index. Data from December 1969 to April 2020.
Although this may seem unintuitive, there is, in fact, a large body of evidence which shows that there is a very weak relationship between equity returns and economic growth. You should not expect the two to move in tandem. Several factors explain this behaviour.
1. Markets are forward-looking
The most important reason is that a company’s stock market value can be thought of as the present value of all its future earnings. These are related to economic growth but not on a one-to-one basis (section 3 gives a brief explanation of some ways they can differ). Its value reflects what is happening right now, but also what is forecast to happen next year, the year after, and so on. Stock markets are forward-looking.
In contrast, much economic data tells you about what has happened in the past. To give an obvious example, GDP growth figures are not released until after the quarter has ended.
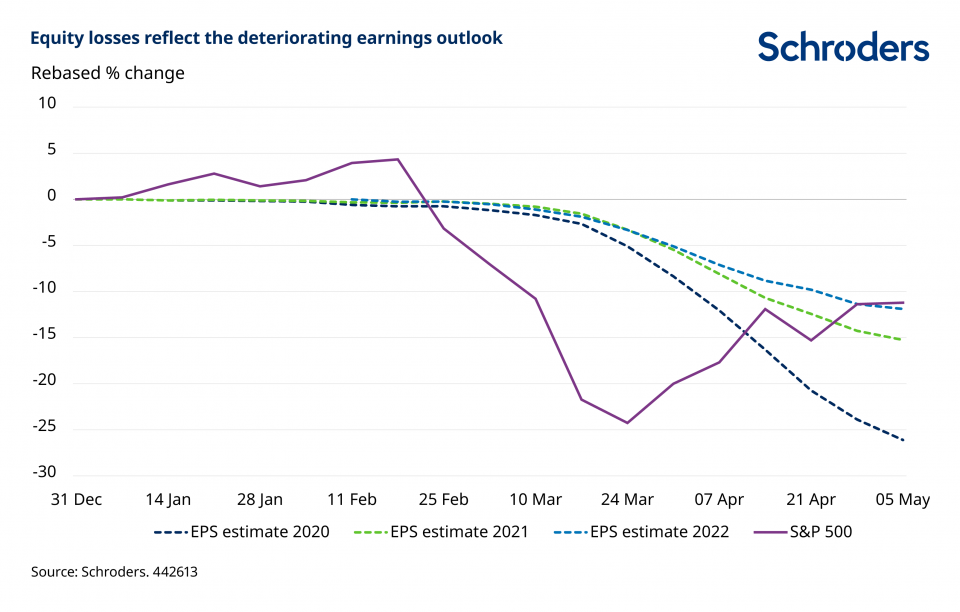
This means any news that impacts profit expectations can move the market before it hits companies’ bottom lines. This is exactly what has happened this year. US stocks fell by 24 per cent in the first three months of the year in anticipation of the economic slump that has subsequently been realised. A lot of bad news was already priced in when we entered April.
Similarly, while it is easy to be fixated on the current dire situation, this is not expected to continue indefinitely. As they reflect all future earnings of a company, stock prices capture both the near-term negative outlook, but also a subsequent recovery (even if the shape of that recovery is open to much debate).
For example, while analysts are forecasting earnings to fall by more than 25 per cent this year, forecasts for 2022 are only around 11 per cent lower than they were at the start of the year. After the recent rebound, this is also relatively close to the year-to-date move in the stock market. The two are fairly consistent.

Past performance is not a guide to future performance and may not be repeated.
Source: Refinitiv Datastream and Schroders. Data from 31st December 2019 to 5th May 2020.
2. Liquidity
As well as stock prices being forward looking, there has also been an additional catalyst which has spurred markets higher in recent weeks. This has led to an even greater disconnect between the market and economy. This catalyst is the huge stimulus package that central banks and governments have unleashed.
The US Federal Reserve has slashed short-term interest rates to zero, pledged to buy government bonds in unlimited amounts, and to buy specified quantities of investment grade corporate debt and high yield exchange-traded funds.
This has been paired with a large fiscal response, including the expansion of unemployment benefits, direct money transfers and loans to small businesses.
These unpredecented measures have helped shore up stock prices by boosting market liquidity, lowering the cost of borrowing, providing financing to corporates and raising business confidence.
Lower interest rates are also positive for markets because they increase the present value of future earnings that would accrue to shareholders. When this happens, stock prices tend to appreciate in value.
3. The stock market does not represent the real economy
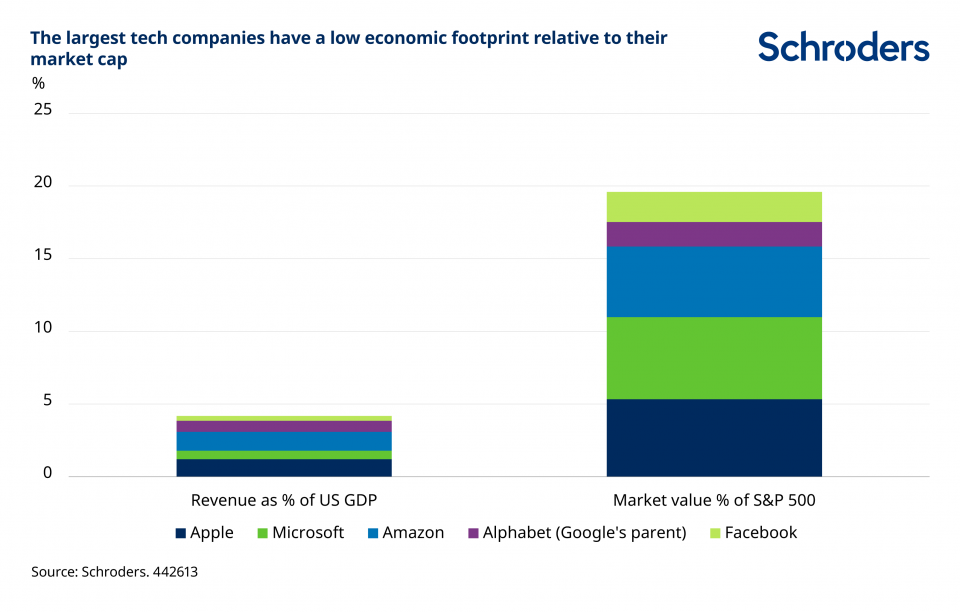
Differences in the composition of the stock market versus the economy have also contributed to the disconnect. For example, the largest tech companies – Microsoft, Amazon, Apple, Google and Facebook – have vastly outperformed the broader market as a result of stay-at-home orders. These firms represent 20 per cent of the S&P 500 Index, yet their combined revenues in 2019 amounted to only 4 per cent of US GDP – 5x less.

Source: Refinitiv Datastream and Schroders. Notes: reported global revenues as at FY2019, with broker estimates used for firms yet to report earnings. Market value as at 1st May 2020.
One reason for this mismatch is that stock market indices such as the S&P 500 are weighted by the market capitalisation of their constituents. The more valuable the company, the larger the index weight. This means smaller firms tend to have little stock market representation, even though they account for 44 per cent of US GDP, according to a report from the US Small Business Administration Office of Advocacy.
Small businesses are likely to suffer more from the economic shutdown because they typically have smaller cash buffers to draw upon compared to larger businesses and have difficulty accessing cheap credit. Yet this adverse impact will not be proportionately captured by the stock market, as most small firms are not publicly listed and those that are will have a low index weight.
Besides sectoral differences, performance may also sometimes diverge because of varying exposure to growth overseas. For example, according to company filings data, US stocks derive around 30 per cent of their revenue from exports, but exports only represent around 12 per cent of US GDP. On this occasion, however, international revenue diversification is unlikely to mitigate domestic headwinds, as nearly all countries globally have shut down their economies, to at least some extent.
Risk of a further correction is still possible
While recent moves in stock prices and economic newsflow may seem at odds with each other, they are not. The forward-looking nature of stock markets means that the market priced in a lot of this bad news when it crashed in the first quarter of 2020. Stock prices also look through the near-term into how company prospects are expected to evolve over the long run – even if that is harder than usual to ascertain at present.
Central bank and government support has also eased fears over some of the worst-case scernarios that markets were worrying about earlier this year. And central bank liquidity injections help to support asset prices.
Does this mean we are out of the woods? Unlikely. Despite all the liquidity sloshing around, that may not enough to keep businesses afloat and get consumers to start shopping again. Revenues are likely to remain under pressure for the foreseeable future. Entire industries are exposed. Many companies are likely to struggle to afford debt repayments, increasing the risk of a wave of defaults and bankruptcies.
With few companies offering earnings guidance amidst the economic uncertainty, markets could be due another correction if things turn out to be worse than expected. After all, in the past, there have been around three “false dawns” during major equity sell-offs.
It is also worth remembering that, although markets have partially recovered losses at the index level, this is not true for all sectors. Depending on their economic sensitivity to the lockdown, there are clear winners and losers emerging. The next phase could well see this trend of diverging fortunes persisting. Investors need to remain on-guard.
Important Information: The views and opinions contained herein are of those named in the article and may not necessarily represent views expressed or reflected in other Schroders communications, strategies or funds. The sectors and securities shown above are for illustrative purposes only and are not to be considered a recommendation to buy or sell. This communication is marketing material.
This material is intended to be for information purposes only and is not intended as promotional material in any respect. The material is not intended as an offer or solicitation for the purchase or sale of any financial instrument. The material is not intended to provide and should not be relied on for accounting, legal or tax advice, or investment recommendations. Reliance should not be placed on the views and information in this document when taking individual investment and/or strategic decisions. Past performance is not a guide to future performance and may not be repeated. The value of investments and the income from them may go down as well as up and investors may not get back the amounts originally invested. All investments involve risks including the risk of possible loss of principal. Information herein is believed to be reliable but Schroders does not warrant its completeness or accuracy. Reliance should not be placed on the views and information in this document when taking individual investment and/or strategic decisions. The opinions in this document include some forecasted views. We believe we are basing our expectations and beliefs on reasonable assumptions within the bounds of what we currently know. However, there is no guarantee than any forecasts or opinions will be realised. These views and opinions may change. Issued by Schroder Investment Management Limited, 1 London Wall Place, London, EC2Y 5AU. Registration No. 1893220 England. Authorised and regulated by the Financial Conduct Authority.