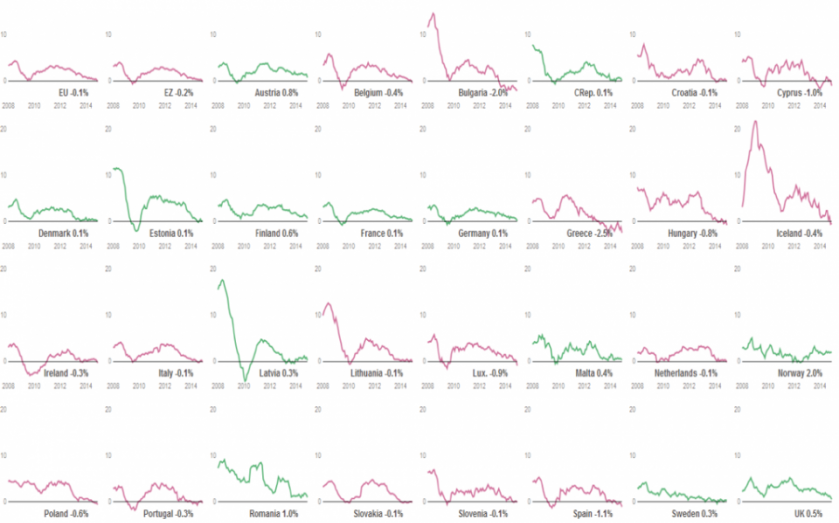
The UK in deflation: 33 charts showing how UK inflation rate compares to every inflation rate in every EU country

The UK officially entered deflation today: prices shrank by 0.1 per cent in the 12 months to April 2015 – the first time it's dipped into negative territory since the 1960s.
Read more: Inflation turns negative for the first time in over 50 years – but it should only be a blip
The fall was caused by dropping energy and food prices, fueled by the global oil-price slump and a supermarket price war.
But in the Eurozone, where a lack of demand driven by high unemployment and low growth is threatening the bloc, which only just scraped to 0 per cent inflation in April, it is hoped the slide into low inflation will be made shallower and briefer by the €1 trillion (£720bn) quantitative easing programme announced by the European Central Bank (ECB).
The figures are for March, the last month for which there is complete data. That shows that, in the EU, the country with the highest inflation is Austria, with 0.9 per cent – still a long way from the ECB's mandated rate of just below two per cent. Greece had the highest deflation in March – prices dipped 1.9 per cent.
Here are the inflation rates of EU and Eurozone countries, with a couple of extras as well. Red lines indicate deflation and green inflation.
[custom id="20"]